In the first part of this blog series, we outlined the challenges that arise when selecting the right tool for test automation. The second part was about the relevance and possible classification of tool selection criteria, some of which can be standardised, but some of which need to be variable. In this third article we will look at the list of criteria, the criteria catalogue, how it was validated and the results of this validation.

List of criteria
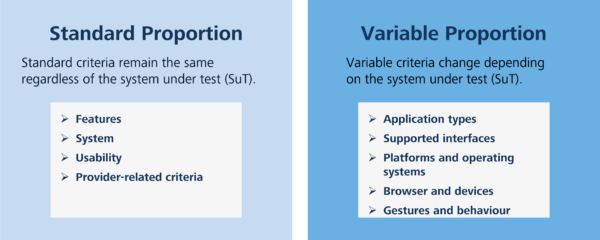
The following figure shows the final list of selection criteria. The variable criteria have been marked as “SuT criteria” (software under test). The criteria identified can be modified, supplemented and updated.
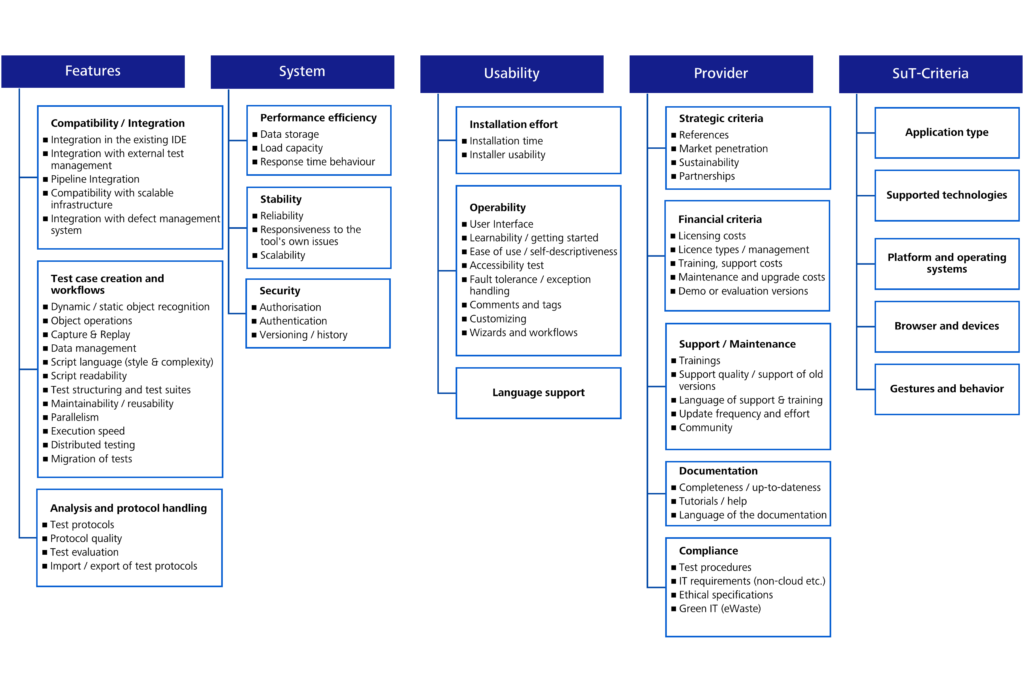
The standard criteria are divided into fourteen (14) main criteria, including compatibility, operability, performance and documentation. Sub-criteria are assigned to the main criteria. For example, the main criterion “documentation” has three (3) sub-criteria.
Criteria catalogue
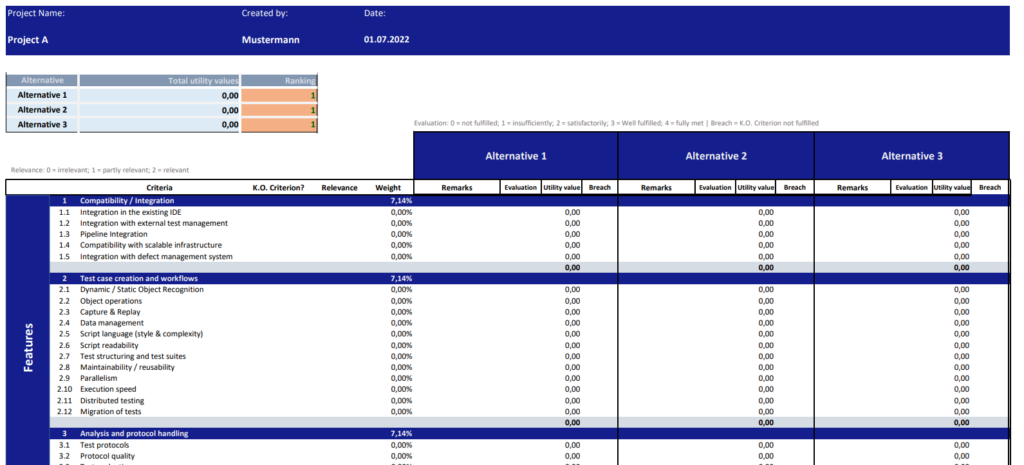
Once the criteria had been established, the next step was to create the actual criteria catalogue. Since there are different, multi-dimensional goals involved in making decisions, it is advisable to take a systematic approach. This requires multi-criteria decision analysis (MCDA). Utility value analysis is one method of multi-criteria decision analysis (Gansen 2020, p. 5). Utility value analysis can be applied whenever an evaluation is being carried out or an assessment is being made, e.g. in project management or controlling.
Requirements for the criteria catalogue
Before actually compiling the criteria catalogue, we started by defining its requirements. These are summarised in the table below in the form of user stories and outline all the work steps required.
| Nr. | User Stories |
|---|---|
| 1 | As a user, I would like to be able to enter project master data in order to better understand by whom, when and for which project the catalogue was created. |
| 2 | As a user, I would like to compile a new catalogue in order to perform a utility value analysis. |
| 3 | As a user, I would like to perform a utility value analysis in order to make an objective decision. |
| 4 | As a user, I would like to apply fair and moderate weighting to the criteria in order to better control their relevance to the project. |
| 5 | As a user, I would like an overview of the basis for evaluation in order to better assess alternative solutions. |
| 6 | As a user, I would like a clear overview of the utility value analysis performed in order to quickly identify the most useful tool. |
| 7 | As a user, I would like to access to the most recently edited utility value analysis in order to make further edits. |
| 8 | As a user, I would like to be able to export the catalogue in order to share it. |
Structure of the criteria catalogue
The criteria catalogue was developed using Excel as well as Visual Basic for Applications (VBA). The developed tool was divided into different workbooks, each reflecting a specific task.
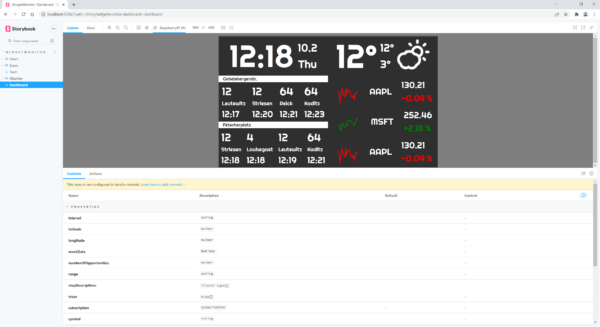
The starting screen
When you open the file, a dialogue window appears (see figure 3). You first have to choose whether to open the most recently edited catalogue or to create a new catalogue. If you want to create a new catalogue, a form is displayed which has to be filled in. SuT criteria entries are added to the catalogue as variable criteria (see figure 4).
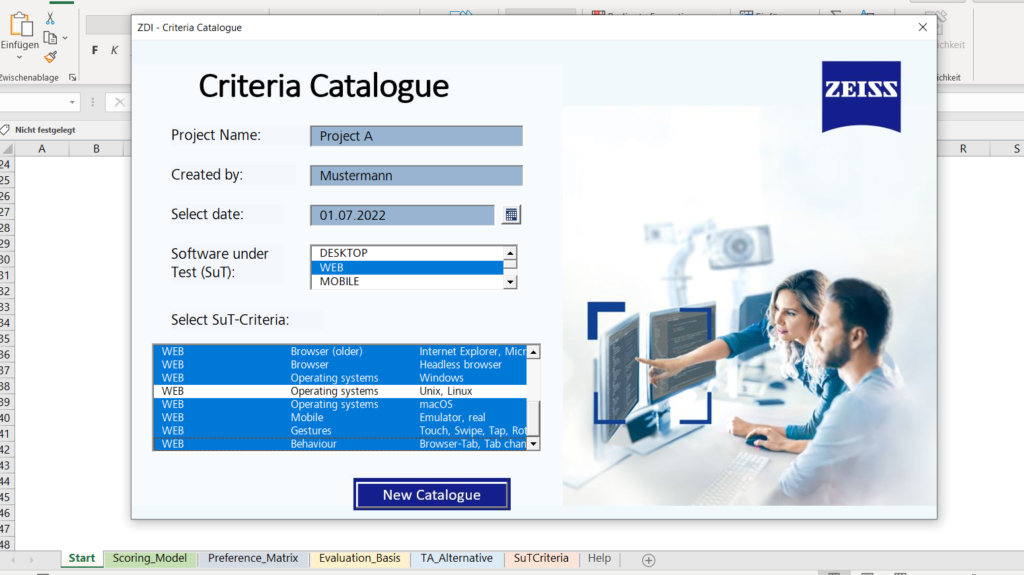
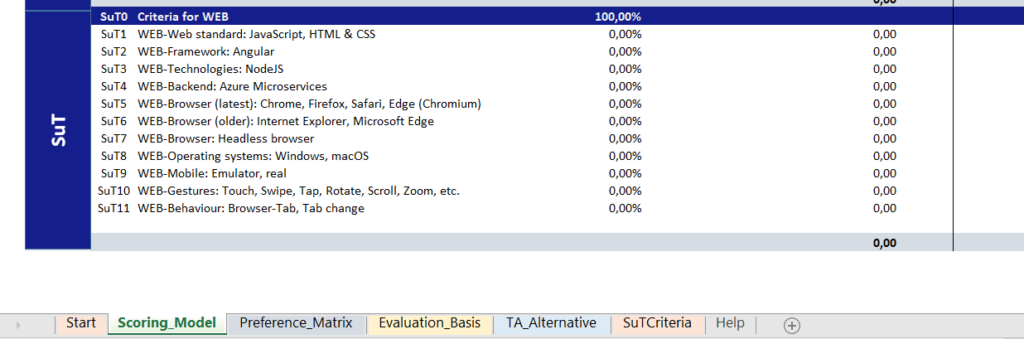
Figure 4: SuT criteria entries in the catalogue
Utility value analysis
A utility value analysis is performed in four steps. Once the criteria have been identified, they are weighted. Then fulfilment of the criteria is measured and finally the utility value is calculated for each alternative (Gansen 2020, p. 6). Once the evaluation criteria have been properly assessed, an objective, rational decision can be made with the help of the utility value analysis (Kühnapfel 2014, p. 4).
Weighting the criteria
Once the criteria, especially the variable criteria, have been established, these criteria need to be weighted. It is crucial to weight the criteria according to their importance for the specific test automation project in order for them to make the best possible contribution towards the achievement of the project’s goals. The sum of the weightings for standard criteria and variable criteria should always add up to 100%. For the standard criteria, the main criteria are weighted first using the pairwise comparison method in the form of a matrix and are compared with each other in pairs (Wartzack 2021, p. 315).
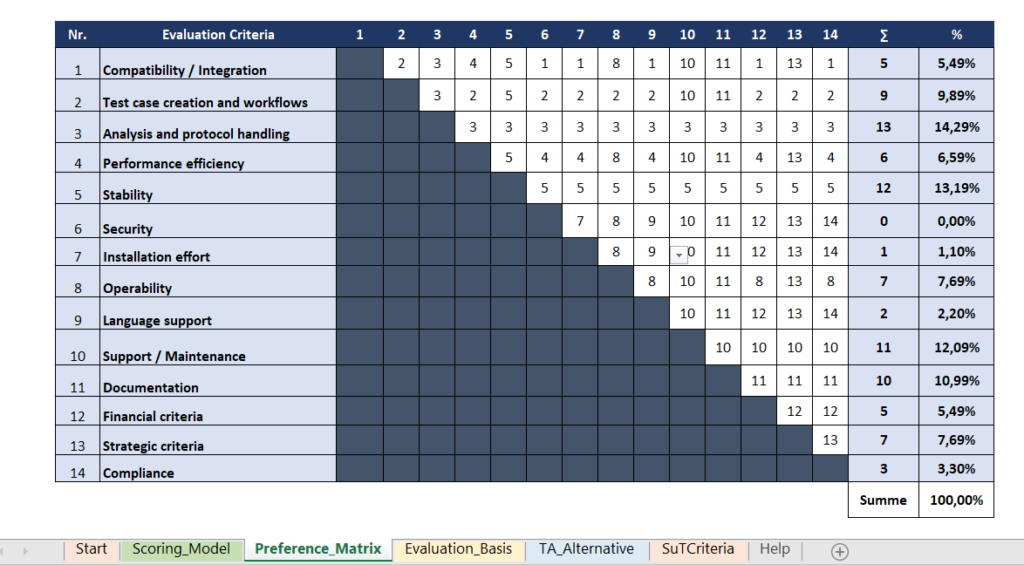
Figure 5: Pairwise comparison of main criteria for a sample project
Main criteria: security, installation effort, language support
The importance of each sub-criterion is then determined using an ordinal scale from zero to two:
0 = “unwichtig”; 1 = “teilweise wichtig”; 2 = “wichtig”
The points awarded are added up and multiplied by the corresponding weighting of the main criterion. This produces a proportional weighting for all standard criteria. The same procedure is applied to the other main criteria and sub-criteria. In the end, the sum of all weightings for the standard criteria equals 100%.
Measuring the fulfilment of criteria
The starting point is to answer the following question: “To what extent is the criterion fulfilled by the test automation tools being assessed?”. A 5-step model is used to determine the degree of criteria fulfilment, as shown in figure 7 (Gansen 2020, p. 17).
| 0 | Not fulfilled. |
| 1 | Insufficiently fulfilled. |
| 2 | Partially fulfilled. |
| 3 | Fulfilled to a satisfactory extent. |
| 4 | Well / completely fulfilled. |
If a score of 4 is given, the tool completely fulfils a criterion. If it does not fulfil the criterion, a score of 0 is given. This method converts the relevant properties of a test automation tool into a measurable quantity.
Evaluation consolidation
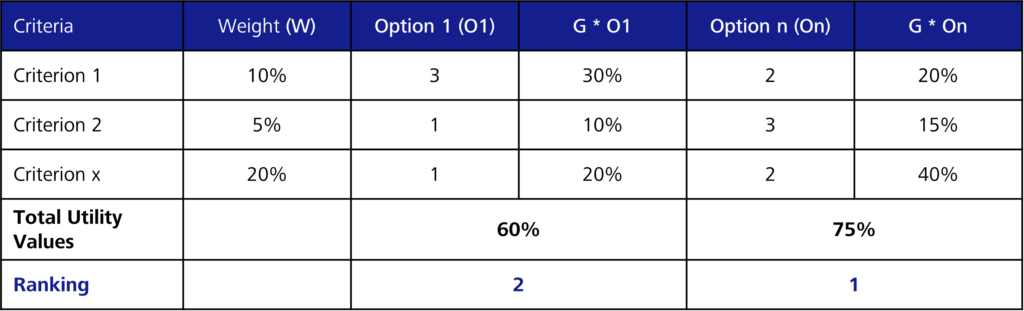
Once the degree of fulfilment has been established for each criterion, the utility value can be calculated. The following formula is used to determine the utility value:
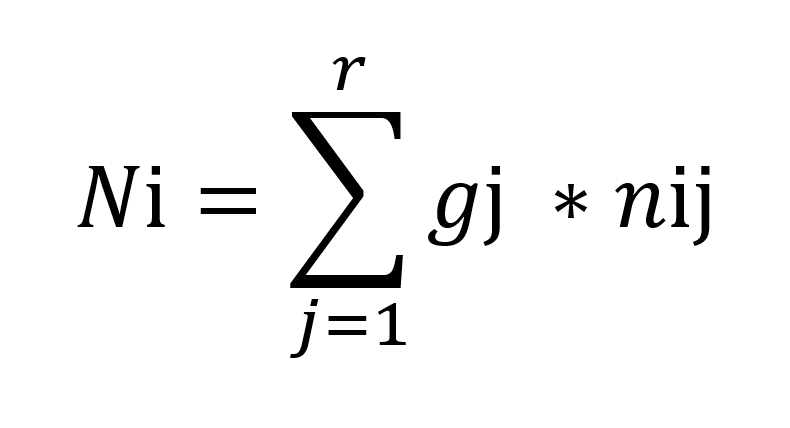
N i = utility values of the alternative i
Gj = weighting of the criterion j
nij = partial value of the alternative i with respect to the criterion j
The partial values are added up. The result represents the actual value of a tool. The alternatives being considered can then be ranked according to the calculated utility values and this can subsequently be used for decision-making (Gansen 2020, p. 6). The tool solution that best meets all requirements and has the highest utility value can be selected.
Certain criteria can be identified as essential. These are called knock-out criteria (K.O. criteria). If a knock-out criterion (K.O. criterion) is not fulfilled (0), this is deemed a “breach”, which leads to the immediate exclusion of the alternative solution.

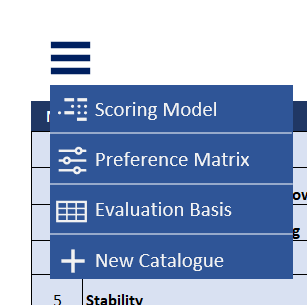
Navigation bar and export
The navigation bar provides the user with an overview of the catalogue’s structure and allows them to navigate through it effortlessly.
The catalogue can be exported as a PDF or Excel file and saved in any location.
Results of the criteria catalogue validation
The following insights were gained from the validation:
- The target model for identifying variable criteria was useful for collecting together ideas for the SuT criteria.
- The use of pairwise comparison helped to identify the important factors and main criteria. The matrix made it possible to make comparisons. This resulted in a significant reduction in “gut decisions”.
- The criteria catalogue offered a systematic, understandable and transparent method for recommending a suitable tool. It was also possible to determine the strengths of the recommended test automation framework. This verified the framework’s coverage of selection criteria with higher relevance. This reduces the need for discussions within the team that would delay the final decision.
- The 5-step model used for evaluation required very in-depth knowledge of test automation tools, which is usually lacking. This would result in staff evaluating some of the criteria based on their own feelings and perceptions. Consequently, the evaluations would be partially subjective and the selected alternative would ultimately not be the optimal one. In order to obtain a more reliable result in this scenario, at least one other person with testing expertise should be involved in the evaluation.
Conclusion & outlook
In this work, we have examined a structured and systematic approach to the selection process. This can be used to select a suitable GUI test automation tool that meets the requirements of both the project and the company. A corresponding criteria catalogue was developed, which primarily provides transparency and comprehensibility in the decision-making process.
We intend to use the criteria catalogue in other projects. The experience gained during this process will be incorporated into the next version of the criteria catalogue (version 2.0).
This article was technically supported by:

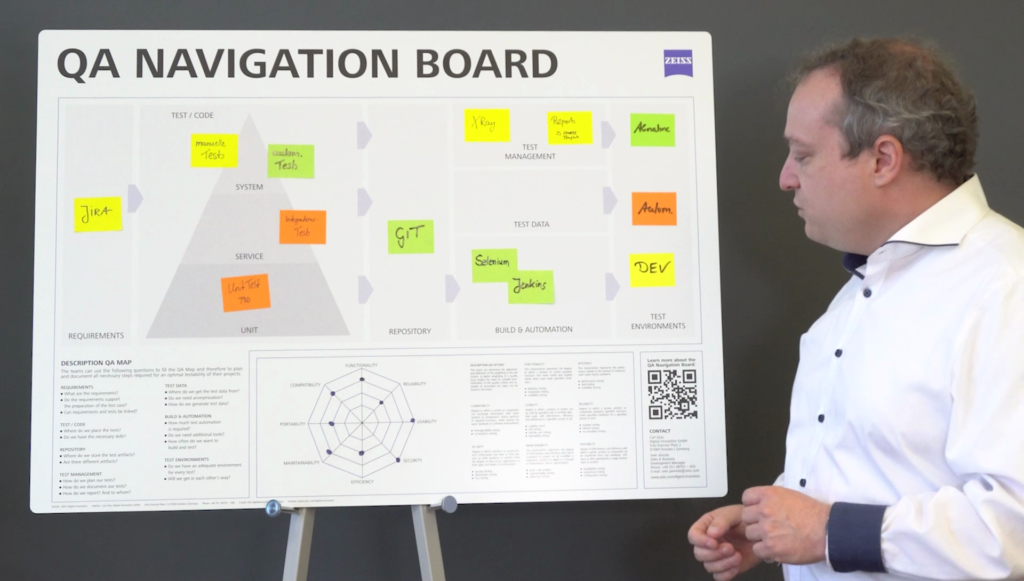
Kay Grebenstein
Kay Grebenstein works as a tester and agile QA coach for ZEISS Digital Innovation, Dresden. Over the last few years, he has ensured quality and tested software in projects in various specialist domains (telecommunications, industry, mail order, energy, …). He shares his experiences at conferences, meetups and in publications of various kinds.