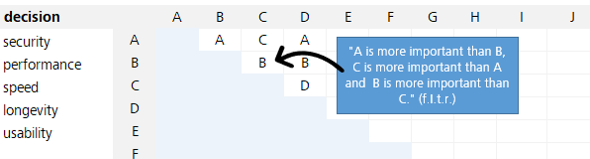
If you need your application written in C# to communicate with a C++ application, perhaps to read sensor data from a hardware component, then you have several options to choose from regarding this communication. This article will look at integration as a COM server. The following will focus on a C++-based COM server from a C# client.
Requirements
To follow this tutorial, you will need the following:
Visual Studio 2019 or a newer version
Visual Studio profile .NET desktop development
Visual Studio profile desktop development with C++
The profiles can be selected and installed via the Visual Studio installer.
Step-by-step instructions: Integrating a C++ COM server with a C# client
Important: More detailed information can be found in this Github repository.
We will also create a C++ server:
Step 1: Create a C++ ATL project with executable file (.exe) as application type.
Step 2: Please delete the ComServerPS project.
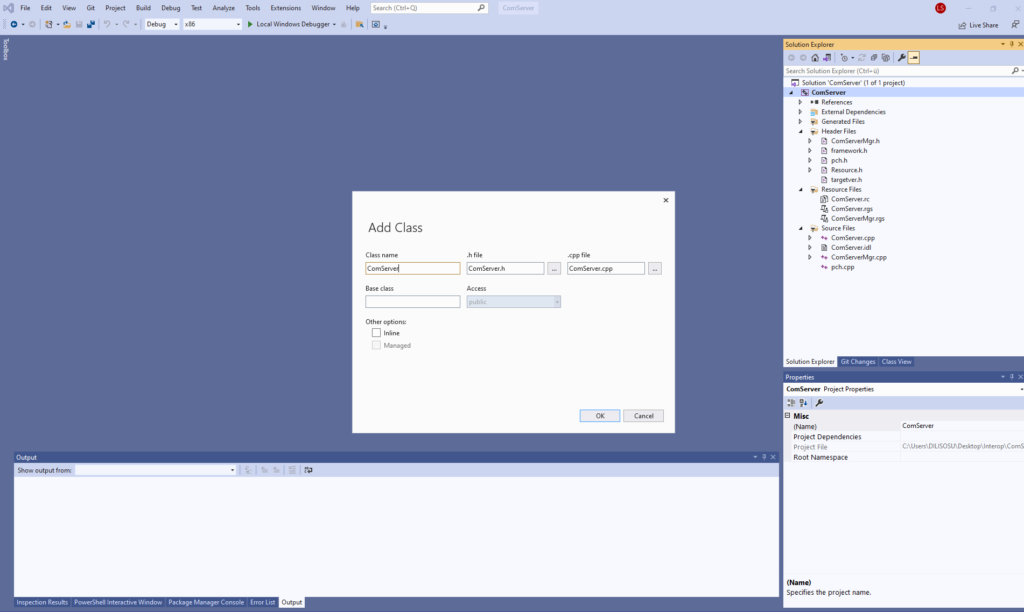
Step 3: Right click on the server and add a new class (ComServerMgr). This should result in the image below:
Figure 1: Adding a new class (ComServerMgr)
Step 4: Add the AddOne() method header in the ComServerMgr.h so that it can be inserted into the class:
Step 5: Add the AddMethod() in the ComServerMgr.cpp. We will use those later to increment the given value by one:
STDMETHODIMP CComServerMgr::AddOne(int value, int* result)
{
	int res = value + 1;
	if (result != nullptr)
	{
		*result = res;
		return S_OK;
	}

	return S_OK;
}
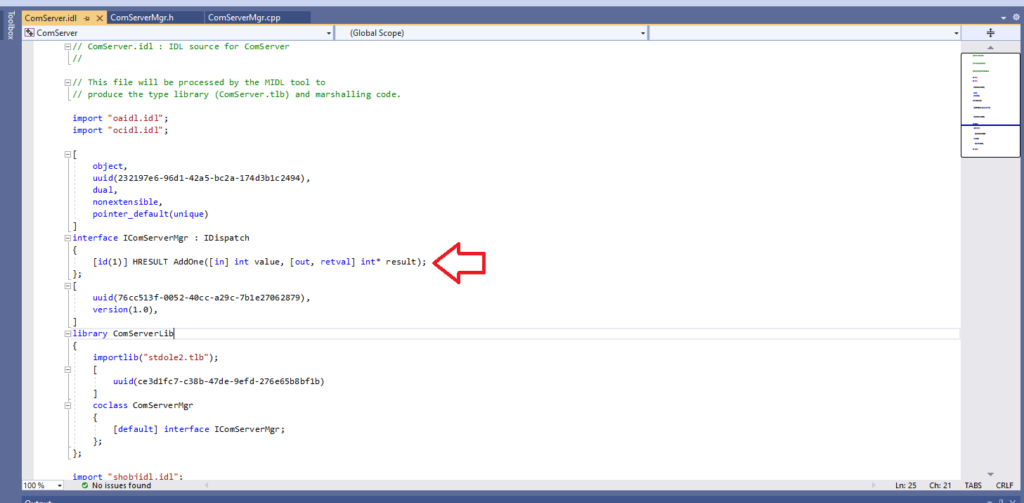
Step 6: Add the AddMethod() in ComServer.idl as well to make it known:
Figure 2: AddMethod() in ComServer.idl
Step 7: Build the project. Now go to the directory on the hard disk where the source code is located and select the subdirectory Build. ComServer.exe should now be located there. Now open the command prompt as administrator and enter the following command:
ComServer.exe /Regserver
Please note that ComServer is the name of the project. If, for example, the project is called “HelloWorld”, then the command should read: “HelloWorld.exe /Regserver”.
Now we will create the C# client.
The process is simpler than that for the COM server:
Step 1: Create a console application.
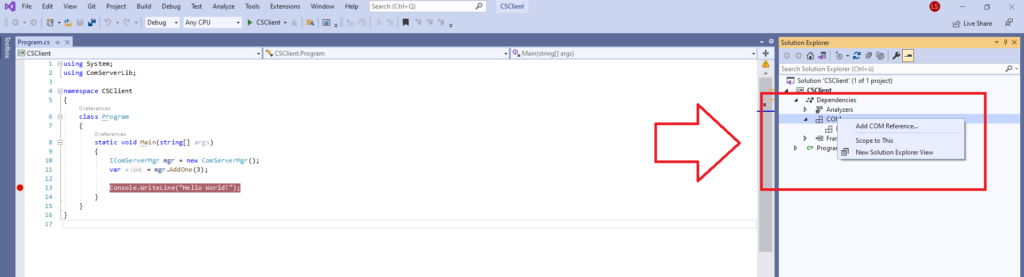
Step 2: Add the COM reference.
Figure 3: Adding the COM reference
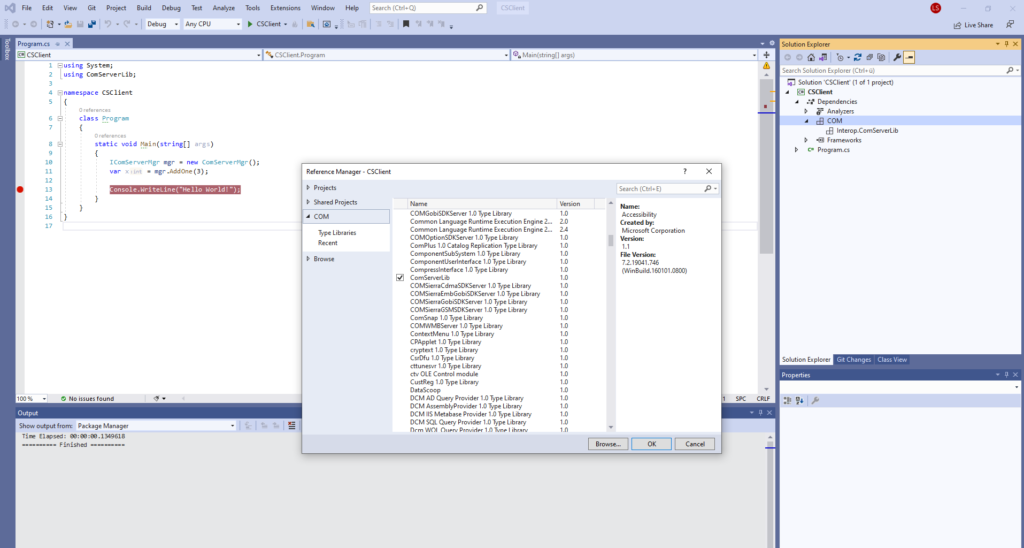
Step 3: Scroll down until the ComServerLib reference is visible:
Figure 4: ComServerLib reference
Please note that the reference is called ComServerLib because the server project is called ComServer. If, for example, the project is called “HelloWorld”, the reference would be HelloWorldLib.
Step 4: Add the following code that instantiates the COM server when the console application is started and then passes the number 3.
    class Program
    {
        static void Main(string[] args)
        {
            IComServerMgr mgr = new ComServerMgr();
            var x = mgr.AddOne(3);

            Console.WriteLine("Hello World!");
        }
    }
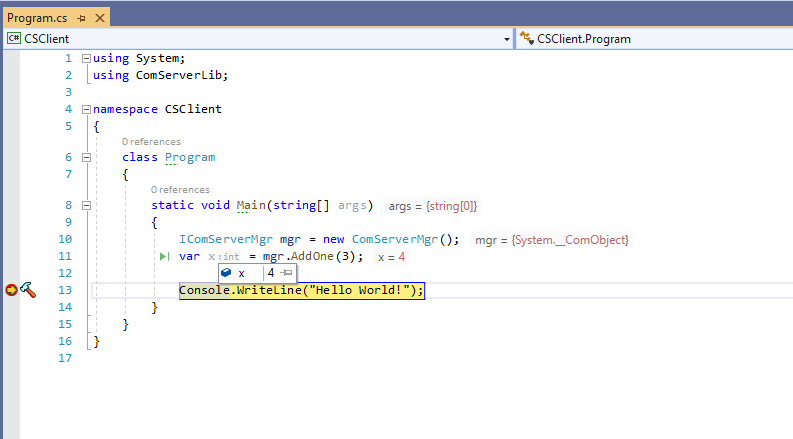
Step 5: It is also possible to run the code in debug mode and with a breakpoint to make this easier to follow. The execution will then stop at the appropriate point.
Figure 5: Running the code in debug mode and with a breakpoint
Summary
Admittedly, the example was very simple, but it demonstrates how to establish a connection between COM servers and C# applications. This is very useful particularly prior to legacy applications, which unfortunately rarely come with any documentation explaining the procedure.
If you have any questions, please feel free to contact me at liviu.sosu@zeiss.com. Thanks to Florian Seeleitner for his helpful support.
The King is dead, long live the King! But which king? After the Angular team announced in April that it would stop development of its Protractor e2e testing framework at the end of 2022, many developers have been asking themselves what will happen next. Which test automation tool should be used? The market has a wide range of alternatives, some of which will be discussed in this article.
The test candidates
Cypress
Cypress is probably the best-known candidate in the test field. According to an Angular Community poll conducted in January 2021, it is the most widely used tool for automated UI testing, with over 60% of the votes. The first stable release was published back in 2017, and the application is currently on version 10. Cypress describes itself as fast, simple and reliable, relying on its own ecosystem of tools that, unlike Protractor, is independent of Selenium and WebDriver. Chrome, Firefox and Edge are currently supported, though not Safari (as yet). The possibility of running tests against various browser versions is offered by either connecting BrowserStack or by swapping the binaries for local execution.
Pro
Contra
+ fast + stable + large community + thorough, easy-to-understand documentation
– still no support for Safari
Table 1: Pros and cons of the Cypress tool
Playwright
Developed by Microsoft since 2020, Playwright is the newest candidate in the field of automation tools. According to its own description, the library is up-to-date, fast, reliable and powerful, thus helping to eliminate common UI testing problems such as flakiness and slow execution speeds. With this aim in mind, it is not surprising that unlike the other testing tools, Playwright is not based on Selenium WebDriver and instead has its own implementation for browser control. The current browser engines from Chromium, Firefox and WebKit are supported on Windows, Linux and MacOS respectively. Older versions can be integrated using older versions of Playwright, and more recently, support has been added for generic Chromium builds (Edge and Chrome). Currently, support for mobile devices is only possible via the emulation of certain device configurations, such as resolution and user agent, and testing on real devices is not possible.
The feature set includes standard operations as well as functions that are missing in other frameworks or which can only be achieved using workarounds. Thus, in addition to clicks, scrolling, selections and so on, drag-and-drop, Shadow DOM interactions and synchronisation with animations are also available.
Im Hinblick auf Performance und Ausführungsgeschwindigkeit verhält sich Playwright wesentlich schneller als In terms of performance and execution speed, Playwright works much faster than Protractor and other Selenium-based testing frameworks. In our tests, we did not detect any problems in terms of flakiness or unexpected crashes, even with several test instances running in parallel. In conclusion, with Playwright, Microsoft provides a modern framework geared towards the requirements of modern UI testing. In its short time on the market, it has already won many advocates and will probably continue to grow in importance in the future.
Pro
Contra
+ fast + stable + large feature set
– currently only offers limited support for BrowserStack – no support for real mobile devices
Table 2: Pros and cons of the Playwright tool
Webdriver.io
It is now over seven years since Webdriver.io was first released, making it one of the longest-standing automation tools in the test field. The creators describe the design of their test framework as expandable, compatible and feature-rich, claims that stand up in the face of closer inspection:
Webdriver.io is a Selenium-based test framework that implements the W3C WebDriver API, which is based on it. This ensures compatibility with all modern browsers (and IE) that provide their own driver implementation. It also enables the testing of web apps on mobile devices, as well as native apps.
The further strengths of the framework become apparent in day-to-day use: A wealth of help methods and syntactic sugar makes formulating test steps and expectations much easier and more readable than was usually the case with Protractor. Some points of note include access to ShadowRoot components via shadow$, versatile configuration options (including automatic test repetitions in the event of errors) and the ability to wait for DOM elements to appear or disappear. However, if a function is not available, it can be implemented as a custom command and then used in the same way as the functions provided.
Despite all the praise, one fly in the ointment remains: Compared to other frameworks, test execution is quite slow due to the Selenium-based implementation, but execution can also be done in parallel.
Pro
Contra
+ versatile compatibility + excellent documentation + numerous support methods and syntactic sugar
– test execution slower than in other frameworks
Table 3: Pros and cons of the Webdriver.io tool
TestCafé
TestCafé is one of the lesser-known candidates in the test field. In the aforementioned Angular community poll, it scored a usage percentage of less than 1%. The first stable release was published in 2018, and the application is currently in version 1.19. Two good reasons to take a closer look included the promise of an easy setup and its independence from WebDriver. Instead, TestCafé uses a rewritten URL proxy called Hammerhead that emulates commands via the DOM API and injects JavaScript into the browser.
All major browsers and the mobile versions of Chrome and Safari are currently supported. Of note is the ability to run tests on real mobile devices across the same network. It is also possible to run tests with BrowserStack. It should also be mentioned at this point that a dedicated development environment (TestCafé Studio) also exists, where you can create and record test cases with just a little programming knowledge.
Pro
Contra
+ fast + versatile compatibility (including for mobile browsers and end devices) + large feature set
– low circulation – test recorder tool is only available at a cost
Table 4: Pros and cons of the TestCafe tool
Comparison
When choosing a testing framework, it is firstly important to know your own project requirements. To this end, the following questions may prove useful:
Which browsers are to be supported?
Are different browser versions to be tested?
Is support required for mobile devices?
Can the app’s core functions be tested using the framework?
Die folgende Tabelle kann bei der Orientierung der Wahl eines TThe following table can help in selecting a testing framework.
Criterion
Cypress
Playwright
Webdriver.io
TestCafé
Browser support (and versions)
o
+
+ +
+ +
Mobile support
+ +
+
+ +
+ +
Range of functions
+
+ +
+ +
+
Test speed
+
+
o
+
Migration from Protractor
o
o
+ +
–
Future-proof
+ +
+
+
o
Table 5: Comparison of test tools based on various criteria
Summary
Given the very wide range of testing frameworks available, it is often tough to make the right decision. For projects with low test requirements, for example, testing against a few, exclusively current browsers, where fast test execution is an advantage, we recommend using Playwright.
However, when the project requires migration from Protractor and it is important to test against a wide range of browsers in different versions and on mobile devices, we recommend using Webdriver.io.
Since 2011, Stefan Heinze has worked in Dresden as a software developer at ZEISS Digital Innovation. He is currently working on Angular applications and Azure back-end development in the medical field. There is an increased focus on the automation of surface tests to ensure software quality.
A few years ago, Harvard Business Review named “data scientist” the “Sexiest Job of the 21st Century” [1] – not least because data-driven companies such as Google, Amazon and Facebook can generate enormous profits. Since then, modern companies have been working on their data infrastructures and terms such as machine learning, data science and data mining are on everyone’s lips. But what exactly do all these terms mean? What do they have in common, what differentiates them? And what does a data scientist actually do? Read on to find out.
Buzzwords
We’re going to start by attempting to clarify the meaning of some keywords. But this comes with a word of warning: as this is still an emerging field that is evolving at a rapid pace, many terms and concepts are still in a state of flux and are sometimes used in different ways. We are going to use the example of a fictitious global logistics company called “OrderNow” to illustrate the key terms.
Data science attempts to generate knowledge from data. The method employed by data scientists is comparable with that of natural scientists, who derive general findings from large volumes of measured data. To do this, they use various algorithms that are developed in an academic context and applied in an industrial environment. An important example of this use of algorithms relates to the prediction of orders. OrderNow’s accounting records indicate which customers ordered what at what time and in what quantity. A data scientist’s algorithm analyses this order data statistically and can then predict when in the future there will be demand for which products and in what quantities. Equipped with this information, OrderNow can place orders with its suppliers in good time and then supply goods to its own customers more quickly.
Big data refers to volumes of data that are too large, too complex, too fast-moving or too unstructured to be evaluated with conventional manual methods of data processing. In our example, this could refer to the constantly growing volumes of historical order data.
A data lake is a system of data stored in its raw format without a structure. More data is stored than is urgently required. In other words, a data lake is a big data repository. OrderNow is made up of many subcontractors with their own established structures. The order data is sometimes in the form of Excel files and sometimes it is recorded as entries in SQL databases.
Machine learning algorithms learn – in a similar way to a human – to identify patterns in data on the basis of examples. Once the learning phase has been completed, these patterns can be identified in new data. This is also referred to as the artificial generation of knowledge from experience. The application of these algorithms often involves the use of neural networks. In the case of OrderNow, this technology is used in the customer app. The user can take photos of objects, the app identifies which product it is and an order can be placed directly. To make this possible, a machine learning algorithm has processed countless categorised image files in order to learn what a particular product looks like and be able to recognise it in new images.
Deep learning is a specialmethod of machine learning which uses neural networks with numerous hidden layers.
Data mining is the attempt to find new interconnections and trends in large databases using statistical methods. As it involves a different approach, data mining is regarded as complementary to machine learning. OrderNow uses data mining to recommend products to its customers.
What does a data scientist do?
Data science can be regarded as the umbrella term that encompasses the other keywords. A data scientist uses methods such as machine learning or data mining to generate knowledge from data.
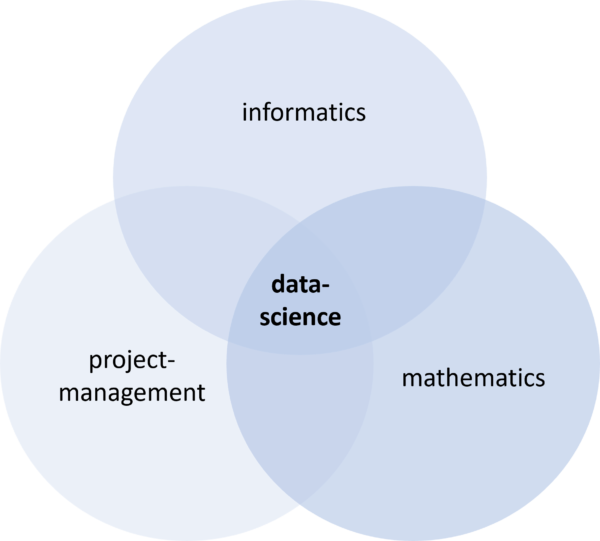
Figure 1: Data scientists use knowledge and skills from the fields of computer science, mathematics and project management.
This requires various skills, as summarised in Figure 1. Data scientists often use the programming languages Python or R, understand databases and know how to process data efficiently. They have a good understanding of mathematics and statistics. The scientific part of their work comprises the process of generating knowledge and also involves them formulating the questions that are to be answered with the database. At the same time, data scientists must also be good at project management. They work in a team with experts from the world of data, they have to be able to communicate results effectively within the company and ultimately they help put their findings into practice in order to create added value.
Using data to create added value
What might this added value look like? Findings that contribute to management decisions on the one hand, optimisation of existing products on the other – in many cases, however, the actual goal is to develop new products. For this to succeed, software developers and data scientists need to work together. The future will reveal how well we manage to put this into practice.
References
[1] Davenport and Patil, Havard Business Review, October 2012
Figure 1: Overview of the learning factory in Görlitz
While more and more start-ups, mid-sized companies and large corporations are using digitalisation and networking to expand their business, and are developing entirely new business models, the global demand for standardisation and implementation expertise is growing. For example, real-life technologies have long been evolving from phrases that previously didn’t hold a lot of meaning, like “Big Data”, “Internet of Things (IoT)” and “Industry 4.0”; such technologies are driving digital transformation while helping companies to increase their productivity, optimise their supply chains and, ultimately, increase their gross profit margins. They primarily benefit from reusable services from hyperscalers such as Amazon, Microsoft, Google or IBM, but are themselves often unable to implement tailor-made solutions using their own staff. ZEISS Digital Innovation (ZDI) assists and supports its customers in their digital transformation as both a partner and development service provider.
Cloud solutions have long been clunky – especially in the industrial environment. This was due to widespread scepticism regarding data, IT and system security, as well as development and operating costs. In addition, connecting and upgrading a large number of heterogeneous existing systems required a great deal of imagination. For the most part, these basic questions have now been resolved and cloud providers are using specific IoT services to recruit new customers from the manufacturing industry.
In order to illustrate the typical opportunities and challenges borne by IoT environments in the most realistic way possible, an interdisciplinary ZDI team – consisting of competent experts from the areas of business analysis, software architecture, front-end and back-end development, DevOps engineering, test management and test automation – will use a proven agile process to develop a demonstrator that can be used at a later date to check the feasibility of customer-specific requirements.
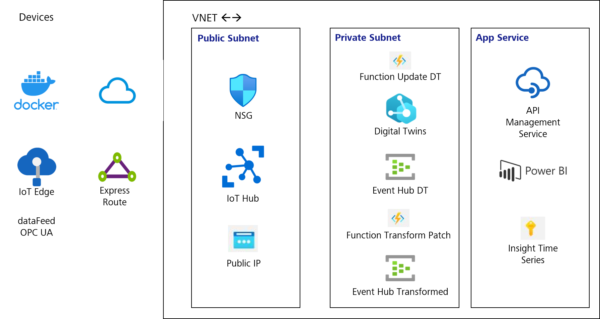
A networked production environment is simulated in the demonstrator using a fischertechnik Learning Factory and is controlled using a cloud application developed by us. With its various sensors, kinematics, extraction technology and, in particular, a Siemens S7 control unit, the learning factory contains many of the typical elements that are also used in real industrial systems. Established standards such as OPC UA and MQTT are used to link the devices to an integrated IoT gateway, which in turn supplies the collected data via a standard interface to the cloud services that have been optimised for this purpose. Conversely, the gateway also allows controlled access to the production facilities from outside of the factory infrastructure while taking the strict IT and system security requirements into account.
Figure 2: Gripping arm with blue NFC workpiece
Establishing and securing connectivity for employees across all ZDI locations after commissioning has occurred is on one hand an organisational requirement, and on the other, already a core requirement for any practical IoT solution with profound effects for the overall architecture. In terms of technology, the team will initially focus on cloud services offered by Microsoft (Azure) and Amazon (AWS), contributing extensive experiences from challenging customer projects in the IoT environment. Furthermore, the focus remains on architecture and technology reviews as well as the implementation of the initial monitoring use cases. Using this as a foundation, more complex use cases for cycle time optimisation, machine efficiency, quality assurance or tracing (track and trace) are in the planning phase.
ZDI is also especially well positioned in the testing services field. Unlike in extremely software-heavy industries such as logistics or the financial sector, however, test managers for numerous production-related use cases were repeatedly confronted with the question of how hardware, software and, in particular, their interaction at the control level can be tested in full and automatically, without requiring valuable machine and system time. In hyper-complex production environments, such as those that ZEISS has come across in the semiconductor and automotive industries, digital twins, which are widely used otherwise, only provide a limited degree of mitigation as relationships are difficult to model and, occasionally, fully unknown influencing factors are involved. This makes it all the more important to design a suitable testing environment that can be used to narrow down errors, reproduce them and eliminate them in the most minimally invasive way possible.
We will use this blog to regularly report on the project’s progress and share our experiences.
Possibilities of the .NET-based open source solution from Microsoft
Routing, load balancing, authentication, authorisation and reliability are important issues in many web projects. Microsoft has a large number of teams that write a reverse proxy for their services themselves or look for solutions to map the tasks mentioned above. This was a good occasion to bring together the different requirements to work on a common solution. YARP was launched – the Microsoft open source project for a reverse proxy in .NET.
Microsoft released the first preview more than a year ago. Ever since, many improvements have been made and YARP has been released in version 1.0 together with the new .NET 6 on 9 November 2021.
In this article we aim to take a closer look at YARP and provide an overview of the configuration options provided to us by Microsoft. Accordingly, we will start by looking at what a reverse proxy actually is and how YARP is positioned. Then we will look at the diverse configuration options and conclude with an outlook.
YARP is written in C# and is built on .NET. It utilises the infrastructure of ASP.NET and .NET. Thus, .NET Core 3.1 and .NET 5 as well as the .NET 6 mentioned above are supported. However, when .NET Core 3.1 is used, some functions are not available, as YARP makes use of some new features and optimisations in the newer .NET versions.
What is a reverse proxy?
A reverse proxy is a type of proxy server that is typically located behind the firewall in a private network and forwards client requests to back-end services. In doing so, the reverse proxy provides an additional abstraction and control layer to ensure the smooth flow of network traffic between clients and servers.
What is YARP?
A classic reverse proxy usually operates on the transport layer (4th layer – TCP/IP) of the ISO/OSI model and routes the requests further and further. In contrast, YARP resides on the 7th layer – here the http layer – and it cuts the incoming connections and creates new ones to the target server. The incoming and outgoing connections are thus independent. This enables remapping of the URL space, i.e. there is a difference between the URLs that are visible from outside and those in the back-end.
The back-end server can be relieved of load by shifting tasks to the reverse proxy.
Why YARP?
The utilisation options of YARP and the many other (classic) reverse proxies vary. A developer in the ASP.NET environment can easily set up, configure and extend the functionality of the reverse proxy in his or her usual programming language. Likewise, the reverse proxy with all its configurations can be versioned with version control, just like any other project. It also has cross-platform capability, i.e. it runs on both Windows and Linux, making it well suited for containerisation.
Functions of YARP
One of the most important requirements is the extensibility and customisability of YARP. For configuration, any source that maps the IConfiguration interface can be connected. Classically, this would be JSON configuration files. The configuration is automatically updated without a restart when changes are made. However, it is also possible to control the configuration dynamically via an API or even on demand per request.
Anatomy of a request
To better understand the functions, it is useful to first get an overview of the pipeline architecture of YARP. Initially, an incoming request lands in the standard ASP .NET middleware (e.g. TLS Termination, Static Files, Routing, Authentication and Authorisation). This is followed by various phases of YARP.
Run through all target servers incl. health check
Session affinity
Load balancing
Passive health checks
Transformation of the request
Forwarding of the request to the target server through a new connection
Routes and clusters
The reverse proxy can be configured for both routes and clusters. The route configuration is an ordered list of route hits with their associated configurations. A route is typically defined by three components: the route ID, cluster ID and a match criterion. Therefore, when an incoming connection arrives, it is compared with the match criterion. In the process, the list of route entries is processed one after the other. If the match criterion is met, the cluster with the specified ID is used for forwarding. However, CORS, transformer, authentication and authorisation can also be configured for a route.
Figure 1 shows an example configuration for routes and clusters.
Unlike the “Routes“ section, the “Clusters“ section contains an unordered collection of named clusters. A cluster primarily contains a collection of named targets and their addresses, each of which is considered capable of handling requests for a particular route. The proxy processes the request according to the route and cluster configuration to select a target.
Figure 1: Example configuration with the basic functions (routes, clusters and load balancing)
TLS termination
As mentioned earlier, incoming connections are cut and new ones to the target server are established. Since TLS connections are expensive, this can improve speed for small requests. This can be useful especially if the proxy forwards to servers that are all on the internal network and a secure connection is no longer necessary. The following possibilities are conceivable here:
Routing of an incoming HTTPS to HTTP connection
Routing of an incoming HTTPS/1 to HTTP/2 connection
Routing of an incoming HTTP to HTTPS connection
Session affinity
Session affinity is a mechanism for binding (affinity) a contiguous request sequence to the target that handled the first request when the load is distributed over multiple targets.
It is useful in scenarios where most requests in a sequence deal with the same data and the cost of accessing data is different for different targets handling requests.
The most common example is transient caching (e.g. in-memory). Here, during the first request, data is retrieved from a slower persistent memory into a fast local cache. Subsequent requests can then be processed with the data from the cache, thus increasing throughput.
Load balancing
If multiple healthy targets are available for a route, one of the following load balancing algorithms can be configured:
Random
Round robin
Least requests
Power of two choices
First
It is also possible to use a self-developed algorithm at this point.
Health checks
The reverse proxy can analyse the health of each node and stop client traffic to unhealthy nodes until they recover. YARP implements this approach in the form of active and passive checks.
Passive
YARP can passively check for successes and failures in forwarding client requests. Responses to proxy requests are intercepted by dedicated passive health checking middleware, which forwards them to a policy configured on the cluster. The policy analyses the responses to determine whether or not the targets that generated them are healthy. It then computes new passive health states, assigns them to the respective targets and rebuilds the cluster’s collection of healthy targets.
Active
YARP can also actively monitor the health of the target servers. This is done by regularly sending requests to predefined state endpoints. This analysis is defined by an active health check policy set for a cluster. At the end, the policy is used to mark each target as healthy or unhealthy.
Unhealthy clusters are automatically blocked through the active and passive checks, and maintenance can be performed without adversely affecting the application.
Transformers
Transformers allow the proxy to modify parts of the request or response. This may be necessary, for example, to meet defined requirements of the target server. The original request object is not changed, only the proxy request. No analysis of the request body is done and no modification of the request and response body takes place. However, this can be achieved via additional middleware – if necessary. It is at this point, for example, where the API gateway Ocelot, which is also based on .NET, could show its strengths. It can perform conversions such as XML to JSON or merge several responses and is primarily aimed at .NET applications with a microservice or service-oriented architecture.
There are some transformers that are enabled by default. These include the protocol (X-Forwarded-Proto), the requested server (X-Forwarded-Host) and the origin IP (X-Forwarded-For).
Accordingly, the origin of the request is still known after the reverse proxy is routed in the back-end via the added header information – this is not the case with classic reverse proxies.
Authentication and authorisation
Authentication and authorisation are possible before forwarding. This allows consistent policies to be mapped across multiple services, eliminating the need to maintain the policies separately. In addition, it leads to a load reduction for the target systems. The authorisation policies are an ASP.NET Core concept. One policy is set per route and the rest is handled by the existing ASP.NET Core authentication and authorisation components.
The following procedures are supported by YARP:
Cookie, Bearer, API Keys
OAuth2, OpenIdConnect, WsFederation
Client certificates
Windows, Negotiate, NTLM and Kerberos authentication, on the other hand, are not supported, as these are usually bound to a specific connection.
Cross-Origin Resource Sharing – CORS
YARP can handle cross-origin requests before they are routed to the target server. This reduces the load on the target servers and ensures consistent policies.
Direct forwarding with IHttpForwarder
If the application does not require the full range of functions, just the IHttpForwarder can be used instead of the full feature set. It serves as a proxy adapter between incoming and outgoing connections.
In this case, the proxy takes over the creation of an HttpRequestMessage from an HttpContext, the sending and forwarding of the response.
The IHttpForwarder supports dynamic target selection, where one defines the target for each request.
Adjustments can be made to the request and response, where the body is excluded. And last but not least, the streaming protocols gRPC and WebSockets as well as error handling are supported.
This minimalistic version does not support routing, load balancing, session affinity and retries – but it does provide some performance benefits.
Outlook
For future releases, the team behind YARP is working on support for HTTP/3, Service Fabric, integration in Kubernetes and further performance improvements.
In addition, Microsoft is trying to develop LLHTTP (Low Level HTTP), an alternative to the current HttpClient, in order to have more control over how requests are made and processed. It is intended to be used especially in scenarios where performance is more important than ease of use. In YARP, it is to be used to gain more control over outgoing connections and for more efficient processing of headers.
Summary
The present article explained the basics of YARP and its extensive features. Using the knowledge gained and the multitude of good code examples in the YARP repository on GitHub, you can now assess whether the functionalities are sufficient for a given use case and create your own reverse proxy.
Since the toolkit is based on the ASP.NET Core stack, it can be run on any environment you have been using for your .NET Core projects.
With YARP, Microsoft delivers a fast and reliable next-generation reverse proxy that will be applied in many projects – not only those of Microsoft.
“Tester Teatime” is a blog post format, which addresses topics that testers deal with on a daily basis. As certain issues or topics tend to recur again and again, the aim here is to create a basis for explaining such phenomena and finding solutions for them. To that end, the blog focusses on stimulating discussions and new ways of thinking. In testing, we can learn a lot from each other by observing our behaviour in our daily lives!
Moderator: Welcome to Tester Teatime! In this interview with testers from ZEISS Digital Innovation (ZDI), we will once again discuss exciting topics.
Today, we are talking to Sandra Wolf (SW), a tester at ZDI, about “spelling”. Sandra, why are we discussing this topic and what’s the connection with software development?
SW: A tester’s normal workday is full of challenges. During the testing process in particular, full concentration is required as every detail has to be checked for quality. One of these details is spelling and grammar. The importance of correct spelling is often underestimated. In our daily work, it is not unusual to find spelling mistakes in the software. But the tester is often ridiculed when they report these to Development for correction. According to the prevailing view, these are only minor and insignificant errors. Today’s talk aims to dispel this opinion. Spelling and punctuation are not exactly the most popular topics and are often perceived as being very dry. Yet these very rules, which we have been learning since our school days, act as a guide for us and our brains. Spelled correctly, a word is easier to read, easier to combine in a sentence to form a statement and thus easier to process for the brain. Attentive readers – or in the case of software development – users will inevitably stumble across incorrect spelling in the software. It has even been demonstrated that certain personality types react differently to incorrect spelling in terms of their emotional response (cf. Weiß, 2016). Thus, contrary to their reputation as being dry, errors in this area can trigger emotions, which in turn affect use of the software.
Image: Stanislaw Traktovenko and Sandra Wolf during the interview at the Tester Teatime.
Moderator: What kind of influence are we talking about here?
SW: For instance, correct spelling radiates respectability. In job applications and official requests, error-free spelling is an absolute must. For example, studies have even shown that a loan application is less likely to be approved if there are linguistic errors in it (cf. Weiß, 2016). If we now apply this to the software we develop, only one possible conclusion can be drawn: Spelling is essential for the user experience and external appearance of the software. And so this topic should clearly be taken more seriously in the development process and receive more attention than it has previously. If we look at the common workday of testers and developers, we know that their focus is on the functionality of the software. Of course, it is understandable that a seemingly cosmetic issue like spelling takes a back seat to elaborately programmed application parts. However, this should not fool all those involved in the process as to its importance. For it is quite clear that the success of a product, and thus also of an application, can be affected by the linguistic quality. First impressions count: When reading a text or using a software, we automatically judge the level of education of the creators based on these (cf. Frost, 2020). Incorrect spelling can therefore cast a bad light on good software.
Moderator: Can you give me a detailed example of this?
SW: Poor spelling can lead to less confidence in the quality of the software and a resulting decline in acceptance of the application. The user might presume that little value is placed on quality in general if even the spelling is handled carelessly. After all, correct spelling expresses not only professionalism but also a certain respect for the reader/user. It has even been found that the quality of a text can affect whether a prospective buyer chooses to make the purchase. Placing this in the context of software development, it can definitely save money if attention is paid to spelling from the onset and reports of such errors are taken seriously (cf. Frost, 2020). Ultimately, we also present our company in our projects, which is why the issue of spelling can have more far-reaching effects than we may initially think. In the best case, good spelling can improve or maintain the reputation of our software development. This in turn can lead to more customers and higher sales because the consistent quality of our software products can be an argument in favour of working with ZDI.
Moderator: I would like to build on this and let Stanislaw Traktovenko (ST) from our usability team have his say. What is the importance of spelling from your point of view? Do you also see the impact to the extent described by Sandra?
ST: The way I see it, spelling has an impact on the readability and therefore on the perception of the information in the application. We assign this to the usability principles of consistency and language. Spelling errors therefore potentially have a direct impact on the usability of an application. For instance, incorrect spelling disturbs the flow of reading and thus the way the user perceives the software. It creates a negative sentiment and the user no longer engages in the task they were actually pursuing with the software. The user is distracted by the incorrect spelling and this affects the user’s effectiveness and efficiency. Even though spelling is only a small part of usability, it can have a bigger impact than we think, as Sandra explained earlier.
Moderator: Thank you Sandra and Stanislaw for these interesting insights. The impact is indeed more far-reaching than expected, which is quite amazing. We can thus summarise that the seemingly dry topic of spelling must be taken seriously in all software projects in order to deliver the highest possible quality and to adequately present both the products and our company. Though the topic of spelling may seem trivial at first, ultimately it has a major effect and is therefore important for all of us. The topic should therefore definitely receive the attention it deserves.
In the following articles, we will address other issues from the daily lives of testers and discuss possible solutions for these.
GraalVM has now been on the market for over two years. It promises two main benefits: better runtime properties and the integration of multiple programming languages.
This blog post will focus on performance; it will not look primarily at whether and to what extent a particular program is executed faster on the Graal JDK than on a conventional JDK. After all, the specific measured values and the relative comparisons are not solely dependent on the program being tested, and they have little general applicability. Moreover, they are merely snapshots: Both GraalVM and, to take one example, OpenJDK, are undergoing continuous development, meaning that the measured values will be continuously changing too. This blog post will instead look at mainly the following questions: Why should GraalVM have a much better performance? What makes it different from conventional JDKs? This will allow us to evaluate whether all programs are executed with a better performance or if no appreciable improvement can be expected, or whether the performance increase is only to be expected in certain application scenarios. And ultimately, whether this means “conventional” Java is too slow.
The development of compilers
The performance of a Java program is fundamentally determined by the compiler, and in this case too, our key focus is to establish what it is that makes GraalVM different. So first, let’s get an understanding of compilers.
In the early days of programming, there were no compilers at all – the machine code was programmed directly. This was confusing and difficult to understand, and it soon led to the development of an assembler code. However, in principle, this was a direct mapping of the machine code, the only difference being that alphabetic abbreviations were now used instead of binary or hexadecimal opcodes. We cannot speak of a programming language and compiler here, at least not within the scope of this blog post.
Over time, it became necessary to develop more and more complicated programs, and the assembly code became increasingly impracticable. For this reason, the first higher programming languages were developed in the 1950s. These needed a compiler to convert the source text into machine code.
The first of these was the classic AOT (ahead-of-time) compiler. The source text is analysed (syntax analysis) and transferred to an internal tree structure (syntax tree), which is used to generate machine code (code generation). This creates a binary file that can then be directly executed.
As an alternative to AOT compilation, a program can also be executed by an interpreter. In this case, the source text is read in and implemented by the interpreter line-by-line. The actual operations (e.g. addition, comparison, program output) are then executed by the interpreter.
Compared to the interpreter, the AOT compiler has the benefit that the programs are executed much faster. However, the generated binary files are system-dependent. What’s more, the interpreter has better error analysis capabilities, since it has access to runtime information, for example.
Java, interpreters and JIT compilers
When the Java programming language was being designed, one of the goals was to ensure that it was architecture-neutral and portable. For this reason, the Java source code was translated into platform-independent bytecode right from the outset. This could then be interpreted by a runtime environment or JRE (Java Runtime Environment). This meant the translated bytecode was platform-independent. For example, applets could be executed on a Windows PC, Mac or Unix workstation without any adaptations, as long as the JRE – regardless of the applet – was already installed on the workstations.
It is worth noting that this idea of a combined solution – AOT up to the bytecode, then interpretation at runtime – does not come from the world of Java. Pascal, for example, was using p-Code as long ago as the 1970s. [1]
When Java technology was released in 1995 [2], this platform independence initially went hand-in-hand with major drawbacks when it came to performance. Many of the programming languages that were relevant at the time, such as “C”, compile their source code directly in machine code (AOT). This can be run natively on the appropriate system, meaning performance is much better than with interpretation of the bytecode. At that time, many IT specialists had come to the conclusion that “Java is slow” – and they were right.
However, “high performance” became an additional goal in the process of designing the Java programming language, which is why the JIT (just-in-time) compiler was introduced in 1998 [2]. This significantly reduced the losses in performance due to pure interpretation.
In JIT compilation, the bytecode is initially interpreted at the program start, but the system continuously analyses the parts of the program to determine which are executed and how often. The frequently executed parts of the program are then translated into machine code at runtime. In future, these parts of the program will no longer be interpreted, and the native machine code will be executed instead. So in this case, execution time is initially “invested” for compilation purposes so that execution time can then be saved at each subsequent call.
JIT compilation therefore represents a middle ground between AOT compilation and interpretation. Platform independence is retained since the machine code is only generated at runtime. And as the frequently used parts of the program are executed as native machine code after a certain warm-up time, the performance is approximately as good as with AOT compilation. As a general rule, the more frequently individual parts of the program are executed, the more the other, interpreted parts of the program can be disregarded in the performance analysis. And this applies above all to frequently run loops or long-running server applications with methods that are called continuously.
Runtime optimisations
With the mechanisms we have looked at so far, the JIT compiler was platform-independent but could not achieve the execution time of the AOT compiler, let alone exceed it. At the time the JIT compiler was integrated into the JDK, it was by no means certain that this would be enough to see it triumph.
However, the JIT compiler does have one significant advantage over the AOT compiler: It is not solely reliant on the static source code analysis, and it can monitor the program directly at runtime. As the vast majority of programs behave differently depending on inputs and/or environment states, the JIT compiler can make optimisations with much greater precision at runtime.
One major benefit in this context is speculative optimisations, where assumptions are made that are true in most cases. To ensure that the program works correctly in all cases, the assumption is supported by a “guard”. For instance, the JVM assumes that the polymorphism is pretty much never used when a productive program is running. Polymorphism is obviously a good idea in general, but the practical application scenarios are usually limited to testing or to decoupling a codebase – and usually to enable use by various programs or for future expansion possibilities. Nonetheless, during the runtime of a specific productive program – and this is the scope of the JVM – the polymorphism is rarely used. The problem here is that, when calling an interface module, it takes a relatively long time for the existing object to find the appropriate method implementation, which is why the method calls are traced. If, for example, the method “java.util.List.add(…)” is called multiple times on an object of the type “java.util.ArrayList”, the JVM makes a note of this. For the subsequent method calls “List::add”, it is speculated that they are ArrayLists again. At first, the assumption is supported by a guard, and a check is made to determine whether the object is actually of the ArrayList type. This is usually the case, and the method that has already been determined multiple times is simply called directly using the “noted” reference.
Over two decades have passed since the JIT compiler was integrated into the JDK. During this time, a great many runtime optimisations have been integrated. The polymorphism speculation presented here is just one small example intended to illustrate the fact that a large number of optimisations have been devised – in addition to the compilation of machine code – that only work at runtime in a complex language like Java. If, for example, an instance is generated using reflection, it is difficult or even impossible for an AOT compiler to identify the specific type and implement speculative optimisation. The speed advantages of the current JIT compilers are therefore primarily based on the fact that they can monitor the program during execution, identify regular operations and ultimately integrate shortcuts.
GraalVM
GraalVM is a JDK from Oracle based on OpenJDK. It offers a virtual machine and a host of developer tools – but the same is also true of the other JDKs. So why is GraalVM generating much more attention that the other JDKs?
Firstly, GraalVM provides a GraalVM compiler, which was developed in Java. In addition, the entire JVM is to be rewritten in Java. In the last section, we showed that current JVMs offer high performance primarily because various optimisations have been included over the decades that are now adding up. These optimisations are mainly Java-specific and are mostly developed by people with a background in Java. If the execution environment is implemented in Java rather than C++, it is possible to make optimisations without any knowledge of C++. This puts the developer community on a broader footing over the medium and long term.
Another exciting aspect of GraalVM is that it supports more than just Java-based languages. The “Truffle language implementation framework” is a starting point for developing domain-specific languages (DSL). The GraalVM compiler supports languages developed with the Truffle framework, meaning these can also be executed in GraalVM and enjoy all the corresponding benefits. Certain languages, such as JavaScript, Python or Ruby, are already supported by GraalVM as standard. Since all Truffle languages can be executed jointly and simultaneously in GraalVM, it is referred to as a polyglot VM.
LLVM-based languages are also supported. LLVM is a framework project for optimising compilers [4][5]. In the LLVM project, compiler components and technologies for external compiler developments are provided, and compilers for many programming languages, like C/C++ or Fortran, are offered too. LLVM runtime is another component of GraalVM that can be used to execute LLVM-based languages on the basis of the Truffle framework in GraalVM. However, we will not go into the polyglot aspect any further as it deserves its own blog post.
GraalVM native image
The innovation that is most relevant to this blog post is native image technology. Native image is a GraalVM developer tool that uses bytecode to generate an executable file. It aims to achieve better performance and reduced main memory usage at runtime. However, we have said that Java is getting faster, with the JIT compiler translating all commonly executed (i.e. relevant) parts of the program into native machine code. The program is monitored during execution, and runtime optimisations are continuously made. So this might lead us to ask: What exactly could be improved here by orders of magnitude?
The answer is incredibly simple: the start time. Even with JIT compilers, the bytecode is initially interpreted. Firstly, the program start is not usually a frequently executed part of the program. Secondly, these parts of the program usually need to run a couple of times first for the JIT compiler to recognise that they are a worthwhile translation target. With runtime optimisations, the behaviour is the same: The program first needs to be monitored at runtime so that the appropriate optimisations can be recognised and integrated. Another complicating factor is that all required objects and their classes, including the complete inheritance hierarchy, need to be initialised at start-up.
Since we now have an idea of “what”, we are interested in knowing “how”: How can our program be made to start faster?
When generating the native image, the bytecode initially undergoes highly extensive static analysis. Amongst other things, this checks which parts of the code can actually be executed at runtime. This includes not only the classes provided by the user but the entire classpath, with the Java class libraries provided by the JVM. Only the identified source code fragments are included in the native image, so the scope is significantly reduced at this stage. However, a “closed-world assumption” is also proposed: As soon as anything is loaded dynamically at runtime, the native image tool has a problem. It does not recognise that these source code parts can also be executed and are thus required. For this reason, anything more than a simple HelloWorld program would not work this way, so when creating the native image you can – and must – give the tool more information about anything that can be called dynamically.
Following the static analysis, the first element that increases the start-up speed is implemented: Since the JIT compiler would start with interpretation, an AOT compiler is used to create machine code. The generated native image is, as the name suggests, machine code that can be executed natively. However, this means that platform independence is lost.
In addition to the natively compiled program, the Substrate VM is included in the native image. This is a stripped-down VM containing only the components required to execute the native image, like thread scheduling or garbage collection. The Substrate VM has its own limitations, with no support provided for a security manager, for example.
An additional increase in the start-up speed is achieved by initialising the native image in advance during creation. Following compilation, the program is started until the key initialisations have completed but no external input needs to be processed. On the basis of this started state, a disk image is created and included in the native image.
We have looked at the “what” and the “how”, and now we turn to a rather critical “why”: The AOT compiler has been known for half a century, and Java has now existed for a quarter of a century. Particularly in early days of Java, various AOT approaches were tried but none ever became established. Why should it be different this time? Why is a reduced start time now of interest, when it goes hand-in-hand with certain disadvantages? Why are high-performance response times in operation over consecutive days or weeks suddenly less important?
The answer can be found in cloud computing, where the services are provided in a different form. Previously, the services were primarily operated in an application container executed day and night and in which the program had already been fully optimised for days. It was usually the case that the application container was not eventually shut down, even when used sparingly (e.g. depending on the time of day). By contrast, the service infrastructure in the cloud can be shut down without problems when not used, enabling capacity to be preserved. At the next call, the infrastructure is started up again and the call is executed. This means that the programs in the cloud may execute a cold start for each call rather than running continuously. As a consequence, the “all at once” start time is extremely crucial. And as it can be expected that even more Java programs will be executed in the cloud rather than in an application container in future, there is likely to be an increased focus on the start time.
Hands on: HelloWorld
After all of that theory, let’s take a look at the JDK in operation. First, we will use the HelloWorld class shown in listing 1.
package de.zeiss.zdi.graal;

public class HelloWorld {

    public static void main(String[] args) {
        System.out.println("Moin!");
    }

}
Listing 1
Here is the classic variant: We are on a Linux VM and an OpenJDK is installed:
> java --version

openjdk 11.0.11 2021-04-20
OpenJDK Runtime Environment (build 11.0.11+9-Ubuntu-0ubuntu2.20.04)
OpenJDK 64-Bit Server VM (build 11.0.11+9-Ubuntu-0ubuntu2.20.04, mixed mode, sharing)

java 11.0.12 2021-07-20 LTS
Java(TM) SE Runtime Environment GraalVM EE 21.2.0.1 (build 11.0.12+8-LTS-jvmci-21.2-b08)
Java HotSpot(TM) 64-Bit Server VM GraalVM EE 21.2.0.1 (build 11.0.12+8-LTS-jvmci-21.2-b08, mixed mode, sharing)
With this setup, we compile the HelloWorld class (javac) and execute the generated bytecode on a JVM:
time java -cp target/classes de.zeiss.zdi.graal.HelloWorld
This gives us the following output:
Moin!

real    0m0.055s
user    0m0.059s
sys     0m0.010s
The total of the two lines “user” and “sys” is relevant to the evaluation here. This is the computing time required to execute the program – in this case, approx. 69 ms.
One note on the 55 ms: From the start to the end, the HelloWorld program required 55 ms of “real time” (the time perceived by the user), which is less than the 69 ms of computing time required. This is due to the Linux system having multiple processors. However, for the purposes of our measurements, we will analyse the computing time applied by the system. Firstly, the computing time is less dependent on the number of processors that have executed the program. And secondly, in the cloud, for example, this is the time that must be paid for by the application operator.
Now we are curious about GraalVM, which is available to download from its website [3]. The Enterprise version (“free for evaluation and development”) is suitable for our evaluation, as most of the performance optimisations are only found here.
The installation is very well documented for Linux and works with virtually no problems. GraalVM is then available for use as JDK.
> java --version

java version "11.0.12" 2021-07-20 LTS
Java(TM) SE Runtime Environment GraalVM EE 21.2.0.1 (build 11.0.12+8-LTS-jvmci-21.2-b08)
Java HotSpot(TM) 64-Bit Server VM GraalVM EE 21.2.0.1 (build 11.0.12+8-LTS-jvmci-21.2-b08, mixed mode, sharing)
We can now compile and execute our HelloWorld program in the same manner with the GraalJDK (javac). This gives us the following output:
Moin!

real    0m0.084s
user    0m0.099s
sys     0m0.017s
Interestingly, the JVM of the GraalJDK needs almost 70% more computing time to execute our HelloWorld example as bytecode. However, the significant performance benefits promised by GraalVM primarily relate to the use of native image technology, rather than to the execution of bytecode.
The native image (the developer tool) is not contained in the downloaded GraalVM, but the command-line tool “gu” (GraalVM Updater) exists for this purpose. This enables us to load, manage and update additional components. In this case too, we find very good support in the GraalVM documentation. Once the developer tool is loaded, we can now generate the native image from the bytecode. With such a trivial program as our HelloWorld example, a single command with the fully qualified class name as the argument is sufficient:
cd ~/dev/prj/graal-eval/target/classes
native-image de.zeiss.zdi.graal.HelloWorld
Creating the HelloWorld native image requires a good three minutes of computing time, and the executable program is approx. 12 MB in size. At first glance, we might compare the size with the bytecode: HelloWorld.class is only 565 bytes. However, the native image contains not only the compiled class but also all relevant parts of the Java class library and the Substrate VM. As a rough estimate, the native image is only 10% of the size of a JRE.
But let’s return to our native image, which we have now managed to create. We can then execute it and obtain the following output.
time ./de.zeiss.zdi.graal.helloworld
Moin!

real    0m0.004s
user    0m0.003s
sys     0m0.001s
For now, we can consider this result to be a relevant speed gain.
Hands on: HelloScript
One of the features of GraalVM that is highlighted again and again is that it is a polyglot VM, rather than just a Java VM. For this reason, we will expand our HelloWorld program to include a short digression into the world of JavaScript. The relevant source code is shown in listing 2. The key difference here is the transition required from the world of Java to the world of JavaScript.
package de.zeiss.zdi.graal;

import javax.script.ScriptEngine;
import javax.script.ScriptEngineManager;
import javax.script.ScriptException;

public class HelloScriptEngine {

    public static void main(String[] args) throws ScriptException {

        ScriptEngine jsEngine = new ScriptEngineManager().getEngineByName("javascript");

        System.out.print("Hello ");
        jsEngine.eval("print('JavaScript!')");
    }

}
Listing 2
Alongside this universal JavaScript connection via javax.script.ScriptEngine, we also want to try out the Graal-specific JavaScript connection using org.graalvm.polyglot.Context. The source text is shown in listing 3.
package de.zeiss.zdi.graal;

import org.graalvm.polyglot.Context;

public class HelloScriptPolyglot {

    public static void main(String[] args) {

        System.out.print("Hello ");
        try (Context context = Context.create()) {
            context.eval("js", "print('JavaScript!')");
        }
    }

}
Listing 3
The two HelloScript programs are translated into bytecode in the same way as the HelloWorld program. When the native images are created, the developer tool must be informed that the world of JavaScript will be used. This is done with the following call:
cd ~/dev/prj/graal-eval/target/classes
native-image --language:js de.zeiss.zdi.graal.HelloScriptEngine
native-image --language:js de.zeiss.zdi.graal.HelloScriptPolyglot
The bytecode can then be executed natively on the VMs or the native images. Since the HelloScriptPolyglot is Graal-specific, we cannot simply execute it on the OpenJDK.
A look at the measured values
Each of the three scenarios was executed as bytecode on the OpenJDK, bytecode on the GraalJDK and as a native image. The average program execution times are listed in Table 1.
Hello World
HelloScriptEngine
HelloScriptPolyglot
Bytecode OpenJDK
69 ms
1321 ms
X
Bytecode GraalJDK
116 ms
2889 ms
2775 ms
Native Image
4 ms
13 ms
11 ms
Table 1: Example of average program execution times
At first glance, we can see that the execution as a native image is much faster in all three scenarios than the conventional bytecode execution.
However, at second glance, we notice that the bytecode execution with GraalJDK requires much more computing time than with OpenJDK: In the HelloWorld example it needs nearly 70% more time, and in the HelloScriptEngine example it needs over 100% more. This was not communicated by Oracle, but in general it is not such a big problem since the faster bytecode execution is probably not the motivation for using GraalVM . Nevertheless, we should keep this fact in the back of our minds when we want to determine the relevant speed-up from the native image, since GraalVM must be installed in order to create the native image. If we measure the bytecode execution for comparison purposes and execute “java -jar …”, the bytecode is executed via GraalVM. However, since it is most likely that OpenJDK has tended to be used until now in productive operations, we should use this for comparison – and this means the speed-up would be “only” just over half as high.
Things to consider
If we want to achieve the promised performance gains, it is not enough to simply install GraalVM instead of a conventional JDK. During bytecode execution, it was not possible to achieve any performance gains – at least with our examples and setup. This is only possible if we use a native image, but we must keep in mind that this has several disadvantages when compared with bytecode execution.
In the native image, Substrate VM is used as JVM. This comes with certain restrictions. Aside from the fact that not all features are currently implemented, there are some things that are not even on the agenda, like a security manager.
We should also keep in mind the duration of the build process: For the native image, the start time does not simply disappear. With different approaches, the computing time is “simply” shifted, from the execution time to the build time. In our environment, it took more than three minutes to create our HelloWorld example, and the process of creating the HelloScript program took more than 20 minutes (HelloScriptEngine: 1291 s, HelloScriptPolyglot: 1251 s).
However, the biggest challenge is the “closed world assumption”. When the native image is created, a static code analysis is run and only the parts of the code that are run through are compiled in the native image. Although this works for our HelloWorld program, command line parameters had to be input for the JavaScript examples. Classes loaded via “reflection” are only recognised if the fully qualified class name is hard-wired in the source code. This results in problems with any technology that uses dynamic class loading in any form, including JNDI and JMX.
The parts of the program that are loaded dynamically can (and must) be explicitly specified when the native image is created. This includes all parts of the program, from the actual project code to all the libraries used, right up to those of the JRE. Since this configuration is a real challenge for “genuine” programs, tools are provided that are likely to be needed for it to work in practice. For example, the tracing agent monitors a program executed as bytecode. It detects all reflective access operations and uses them to generate a JSON configuration. This can now be used to create the native image.
In practice, the build pipeline would therefore initially create the bytecode variant. All automated tests can then be run with this bytecode variant, and the tracing agent detects the reflective access operations. Assuming that every program path is really executed in this process, the native image can then be generated in a further build step. This takes us directly to the next point: When working with native image technology, the build process becomes longer and more complex overall.
In summary, this means that some things are impossible or close to impossible when using native image technology (e.g. security manager). Although many other things generally work, they require extensive configuration. Tool support is available for this and is undergoing extremely dynamic development. The hope here is that the tools will be able to compensate for the additional work (aside from the build duration). However, this will also make the build process more complex and thus more susceptible to errors.
Pitfalls in Windows
Finally, we will take a look at the Windows platform, which is now also supported. In preparation for this blog post, the “GraalVM Enterprise 20.3.0” and “GraalVM Enterprise 21.0.0.2” versions were tested on a Windows system. Unfortunately, the relevant documentation was still a little lacking here and the tooling does not mesh quite as well as in the Linux environment, so there were some obstacles that were not noticeable in Linux. For instance, there was a problem creating a native image when the underlying bytecode was generated by a different JDK (in this case, by OpenJDK). The error message that appeared was not very helpful either, as it gave no indication of the actual cause.
native-image de.zeiss.zdi.graal.HelloWorld

[de.zeiss.zdi.graal.helloworld:20764]    classlist:     947.02 ms,  0.96 GB
[de.zeiss.zdi.graal.helloworld:20764]        (cap):   3,629.54 ms,  0.96 GB
[de.zeiss.zdi.graal.helloworld:20764]        setup:   5,005.98 ms,  0.96 GB

Error: Error compiling query code (in C:UsersxyzAppDataLocalTempSVM-13344835136940746442JNIHeaderDirectives.c). Compiler command ''C:Program Files (x86)Microsoft Visual Studio2019BuildToolsVCToolsMSVC14.28.29333binHostX64x64cl.exe' /WX /W4 /wd4244 /wd4245 /wd4800 /wd4804 /wd4214 '-IC:Program FilesJavagraalvm-ee-java11-21.0.0.2includewin32' '/FeC:UsersxyzAppDataLocalTempSVM-13344835136940746442JNIHeaderDirectives.exe' 'C:UsersxyzAppDataLocalTempSVM-13344835136940746442JNIHeaderDirectives.c' ' output included error: [JNIHeaderDirectives.c, Microsoft (R) Incremental Linker Version 14.28.29337.0, Copyright (C) Microsoft Corporation.  All rights reserved., , /out:C:UsersxyzAppDataLocalTempSVM-13344835136940746442JNIHeaderDirectives.exe , JNIHeaderDirectives.obj , LINK : fatal error LNK1104: Datei "C:UsersxyzAppDataLocalTempSVM-13344835136940746442JNIHeaderDirectives.exe" kann nicht ge?ffnet werden.]

Error: Use -H:+ReportExceptionStackTraces to print stacktrace of underlying exception
Error: Image build request failed with exit status 1
There was another pitfall when it came to operating across drives, as it is unfortunately not possible in Windows to install GraalVM on one drive (in this case, C:\Program Files) and execute it on another drive (in this case, D:\dev\prj\…):
native-image de.zeiss.zdi.graal.HelloWorld

[de.zeiss.zdi.graal.helloworld:10660]    classlist:   3,074.80 ms,  0.96 GB
[de.zeiss.zdi.graal.helloworld:10660]        setup:     314.93 ms,  0.96 GB

Fatal error:java.lang.IllegalArgumentException: java.lang.IllegalArgumentException: 'other' has different root
        at java.base/jdk.internal.reflect.NativeConstructorAccessorImpl.newInstance0(Native Method)
[…]
In addition, it was not possible to identify any performance benefits with the native image in the Windows environment. At present, Windows support (both the GraalVM toolchain itself and the generated native images) is thus rather experimental.
Summary
This blog post has looked primarily at how the start time for Java programs can be massively improved with GraalVM native image technology. It has shown what approaches and technologies GraalVM uses to do this. The results are backed up by measurements from example programs. However, certain challenges were mentioned that arise when native image technology is used.
Virtually no performance improvements can be expected for longer-running programs since the optimisations in conventional JVMs would also apply in such cases. For now, this is just an assumption. An investigation of this aspect would be beyond our scope here and has enough potential to merit its own blog post.
Let’s now turn to the questions from the introduction. In principle, “conventional” Java has not been slow for a very long time; in fact, it is extremely fast. Its use in the (computationally intensive) big data environment is enough of an indication that this is the case. The main prerequisite for a high level of performance is a certain warm-up time. The reverse conclusion is that starting a conventional Java program leaves a lot to be desired, and this is exactly where native image technology comes in. On the other hand, this technology comes with a number of drawbacks, particularly for large, technology-heavy applications.
In summary, GraalVM has the potential to establish itself in various fields of application. Applications in multiple languages could make use of the polyglot properties, and the use of the native image technology that we covered is definitely a viable option for cloud services in particular. However, the use of GraalVM is probably not worthwhile for applications that are computationally intensive (usually those that are longer-running) and non-trivial.
Finally, we should mention the fact that the compiler and optimiser are implemented in Java as a benefit of GraalVM. Although this is initially not better or worse than the previous implementations, it increases the chances of making better use of the potential of the Java community in the medium and long term.
Overall, it remains exciting. At the moment, it is not possible to foresee OpenJDK being replaced entirely. And we should remember that developments in that area are also continuing apace. Nevertheless, GraalVM certainly has the potential to establish itself (at least initially) in specific fields of application.
This blog post addresses the high standards of security and compliance that we have to meet in every software project. Trained security engineers are responsible for ensuring that we achieve this within any given project. An especially persistent challenge they face is dealing with the countless dependencies present in software projects, and getting them – and their variety of versions – under control.
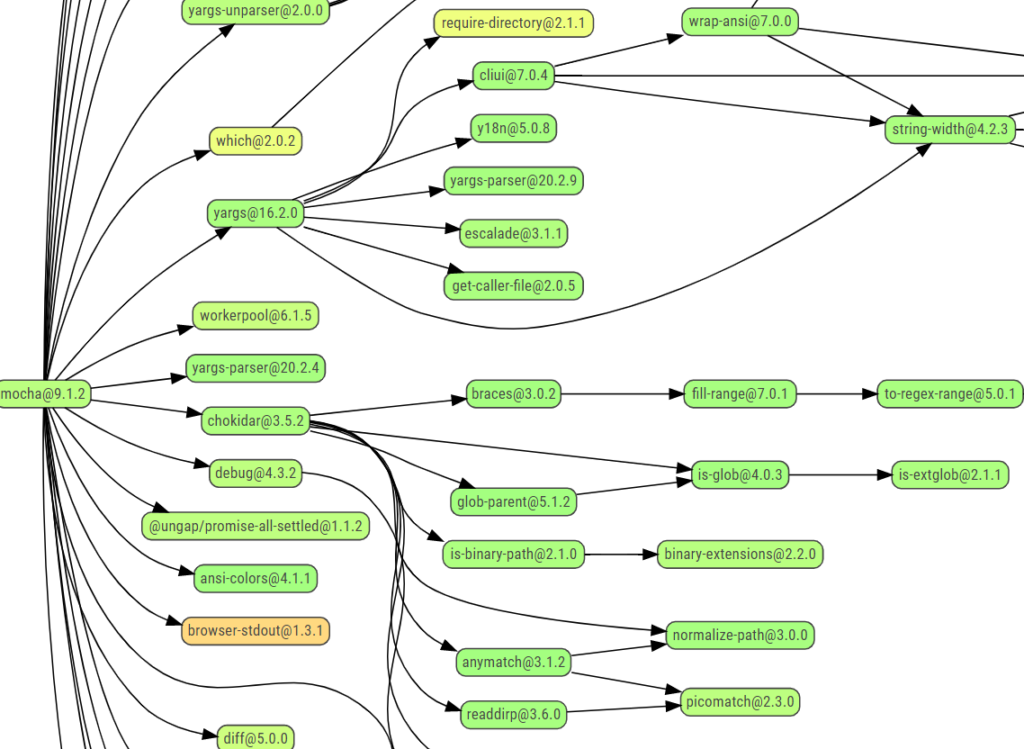
Figure 1: An excerpt from the dependency graph of an npm package, taken from npmgraph.js.org/?q=mocha
Challenges in software projects
For some time now, large-scale software projects have consisted of smaller components that can each be reused to serve their particular purpose. Components with features that are not intended to be kept clandestine are increasingly being published in the form of free and open-source software – or FOSS for short – which is freely licensed for reuse.
To assess and prevent security vulnerabilities, it is vital that we have a complete overview of all the third-party libraries we are integrating, as any of our imported modules may be associated with multiple dependencies. This can result in the overall number of dependencies that we are aware of stretching into the thousands – making it difficult to maintain a clear picture of licences and security vulnerabilities among the various versions.
Based on reports of incidents in recent years, such as supply chain attacks and dependency hijacking, there is no mistaking the significant impact that issues like these can have. For an interesting meta-analysis of breaches of this kind, we would recommend Ax Sharma’s article “What Constitutes a Software Supply Chain Attack” (https://blog.sonatype.com/what-constitutes-a-software-supply-chain-attack). Here, we’re going to delve deeper into how to handle components in both large-scale and small-scale software projects, working from the perspective of a security engineer.
FOSS scanning tool solutions
Over time, some projects have managed to overcome the issues associated with identifying FOSS components. Today, there are programs available for creating bills of materials (BOMs) and overviews of security risks, and we have tried these out ourselves.
There are also large catalogues such as Node Package Manager (npm), containing detailed information about the components available in any given case.
Open-source components of this kind might be free to use, but they still involve a certain amount of work, particularly in cases where they are being used in major and long-term software projects.
To perform our own evaluations, we have combined the OWASP Dependency-Check (DC) tool and the OSS Review Toolkit in order to create a solution for identifying security problems through DCs and checking that licensing conditions are being adhered to. Compared with commercial solutions such as Black Duck, these tools provide a free, open option for gaining an overview of FOSS components in projects and evaluating the risks associated with them.
That said, our experience has shown that these tools also involve additional work in the form of configuration and ongoing reviews (in other words, re-running scans in order to identify new security issues).
What software engineers are responsible for
Our guidelines for ensuring secure development and using open-source tools outline the processes we require and the goals that our security engineers have to keep in mind when they are approaching a project. Below is probably the most important part of those guidelines:
It is our responsibility that the following so called Essential FOSS Requirements are fulfilled:
All included FOSS components have been identified and the fitness for purpose has been confirmed.
All licenses of the included FOSS have been identified, reviewed and compatibility to the final product/service offering has been verified. Any FOSS without a (valid) license has been removed.
All license obligations have been fulfilled.
All FOSS are continuously – before and after release – monitored for security vulnerabilities. Any relevant vulnerability is mitigated during the whole lifecycle.
The FOSS Disclosure Statement is available to the user.
The Bill of Material is available internally.
For that it must be ensured that
the relevant FOSS roles are determined and nominated.
the executing development and procurement staff is properly trained and staffed.
These guidelines form the basis for developing mandatory training, equipping subject matter experts with the right knowledge and putting quality control measures in place.
The processes involved
Investigation prior to integration (licences and operational risks such as update frequency)
Update monitoring (operational risks)
Let’s say that a new function needs to be built into a software project. In many cases, developers will already be aware of FOSS tools that could help introduce the function.
Where feasible, it is important that whichever developer is involved in the project knows how to handle package managers and the potential implications of using them so that they know how to account for the results produced by tools or analyses. As an example, developers need to be able to visualise how many parts are involved in a top-level dependency, or evaluate various dependencies associated with the same function in order to maintain security in any future development work. In other words, they must be able to assess operational risks. More and more nowadays, we are seeing projects that aim to keep the number of dependencies low. This needs to be taken into account when selecting components so that, wherever possible, additional dependencies only provide the functions that are really needed.
Before integration, the security engineer also has to check potential imports for any security vulnerabilities and verify that they have a compatible licence. An equally important job is reviewing the operational risks, involving aspects such as the following:
How up-to-date the import is
Whether it is actively maintained or has a keenly involved community
Whether the update cycle is agile enough to deal with any security vulnerabilities that crop up
How important secure handling of dependencies is considered to be
Whether the number of additional dependencies is reasonable and whether it is reduced where possible
During the development process and while operation is taking place further down the line, the project team also has to be notified whenever new security vulnerabilities are identified or closed. This may involve periodic scans or a database with security vulnerability alerts. Periodic scans have the advantage of running more independently than a database, which requires hardware and alerts to be provided. However, alerts are among the benefits offered by software composition analysis solutions such as Black Duck.
As the number of well-marked FOSS tools rises, the amount of time that needs to be invested in curating them manually is becoming comparatively low. The work that does need to be done may involve declaring a licence – and adding easy-to-find, well-formatted copyright details to components, as these have often been given highly unusual formats or left out altogether in older components. Cases in which no licence details are provided should never be misconstrued as carte blanche invitations to proceed – without a licence, a component must not be used without the author’s consent.
Example of a security vulnerability
An example of a complex security vulnerability was published in CVE-2021-32796. The module creating the issue, xmldom, is indirectly integrated via two additional dependencies in our example project here.
Black Duck shows the following security warning related to the module:
Figure 2: Black Duck example summarising a vulnerability
This gives a security engineer enough information to make a broad assessment of the implications that this vulnerability has. Information is also provided with the patch in version 0.7.0.
The importance of having enough time in advance when it comes to running updates/replacing components
Before issuing new publications under @xmldom/xmldom, we have had the time to check how much work would be involved if we were to do without this dependency.
To benefit from this kind of time in a project, it is useful to gain an overview of potential issues right at the development stage, and ensure that there is enough of a time buffer leading up to the point at which the product is published.
This makes it easier for developers to evaluate workarounds for problematic software libraries, whether they are affected by security vulnerabilities, incompatible licences or other operational risks.
Summary
This post has provided an overview of the project work we do involving the large variety of open-source software out there, and has outlined what security engineers need to do when handling open-source software. By using the very latest tools, we are able to maintain control over a whole range of dependencies and establish the transparency and security we need. Dependencies need to be evaluated by a trained team before they are integrated and then monitored throughout the software lifecycle, with the team responding to any issues that may arise.
As the Industry 4.0 concepts mature, we will look at the Azure edition of Digital Twins. The definition of Digital Twins assumes the digital representation of real-world things’ (or people’s) properties, either in real time (for control and predictive maintenance) or in simulations to acquire and test behaviors before actual deployment. As such, Azure Digital Twins are closely related to Azure IoT services; however, they could do a bit more, as we will see below.
How are models created and deployed?
Azure Digital Twins relies on Digital Twins Definition Language (DTDL), which follows JavaScript Object Notation for Linked Data (JSON-LD), making it language-agnostic and connected to certain ontology standards. Root structure is declared as interface, which can contain properties, relationships, and components. Properties can contain telemetries (event-based, like temperature readings) or values (e.g., name or aggregate consumption), relationships describe connection between Twins (for example, floor contains room), and finally, components are also models referenced in interface per id (e.g., phone has camera component).
Models support inheritance, thus one can already think of these models as serverless (POCOs) classes. Indeed, from these models, instances are created which live in Azure Digital Twins. The logical question arises, if these are somehow classes, what about methods? This is where serverless Azure Functions find its use very well, as all events from Digital Twins can be captured and processed with Azure Functions. Hence, Azure Digital Twins, paired with Azure Functions, create powerful serverless infrastructure which can implement very complex event-driven scenarios by utilizing provided REST API for model and data manipulation. The price for this flexibility is a rather steep learning curve, and one must write functions for data input and output from scratch.
Json models can be created by hand, or even easier, Microsoft provides sample ontologies (prefabricated domain models) available in Excel that can be extended or adapted. Using Digital Twins Explorer (currently on preview in Azure Portal), these models can be uploaded in Azure with already prescribed instance and relationship creation automatization. Underneath Azure Digital Twins Explorer is REST API, so one can also programmatically do this as well.
In our sample smart building implementation (depicted in Image 1) we created and uploaded models (shown on the left) and instances with relations (shown on the graph on the right). There is a company model instance for ZEISS Digital Innovation (ZDI), which has two buildings Dresden and Munich each containing floors, rooms, and elevators.
Figure 1: Modeling
How data come into the system?
In our smart building implementation (depicted in Image 2) we utilize IoT Hub to collect sensor data from rooms (temperature, energy consumption, number of people in the rooms, etc.), as well as OPC UA converted data from elevators.
Figure 2: Architecture
Normally, IoT Hub easily integrates with Insight Time Series with a couple of clicks out of the box, but some functions are necessary to intercept this data with Digital Twins. The first function reacts to IoT Hub Event Grid changes and propagates updates to Digital Twins, which can then trigger other functions, for example calculating and updating the aggregate energy consumption in the room and propagating this to all parents. All these changes in Digital Twins are streamed to the Event Hub in an update patch format that is not readable by Insight Time Series. Here comes another function which converts these patch changes and streams them to another Event Hub to which Insight Time Series can subscribe and save the data. Sounds over-engineered? It is! As mentioned, there is a lot of heavy lifting that needs to be done from scratch, but once familiar with the concepts, the prize is flexibility in implementing almost any scenario. From vertical hierarchies with data propagations (such as heat consumption aggregations) to horizontal interactions between twins based on relationships (as in when one elevator talks and influences the other elevators’ performance in the same building based on an AI model) can be implemented.
Another powerful feature is that we can stream and mix data from virtually any source in Digital Twins to extend their use for business intelligence. From ERP and accounting systems, to sensors and OPC UA Servers, data can be fed and cross-referenced in real time to create useful information streams – from tea bags that will run out in the kitchen on a snowy winter day to whether the monetary costs for elevator maintenance are proportional to the number of trips in year.
How are the data analyzed and reported?
In many industrial systems, and thanks to increasing cheap storage, all telemetry data usually land in a time series for analytics and archiving.
However, data alarms, averages, and aggregations can be a real asset in reporting in real time. Digital Twins offer full REST API where twins can be queried based on relations, hierarchies, or values. These APIs can be also composed and exposed to third parties in API Management Services for real-time calls.
Another way is to utilize Time Series Insights for a comprehensive analysis on complete data sets or using time series dumps to create interactive reports using Power BI.
Both real-time and historical reporting has its place and optimal usage determination should be based on concrete scenarios.
Summary
Azure Digital Twins offer language-agnostic modeling that can accept a myriad of data types and support various ontologies. In conjunction with serverless functions, very complex and powerful interactive solutions can be produced. However, this flexibility comes with high costs for manual implementation in data flow using events and functions. For this reason, it is reasonable to expect that Microsoft (or an open source) will provide middleware with generic functions and libraries for standard data flows in the future.
A not inconsiderable part of the work of a software architect consists of comparing different solution alternatives with each other. Decision tables or evaluation matrices are often used for this purpose, whereby both terms are usually used synonymously. This article aims to provide an insight into two basic approaches and to evaluate them according to their suitability.
Figure 1: Software architects often have to compare different solution alternatives with each other. To do this, they often use certain evaluation matrices.
Types of evaluation matrices
Evaluation methods for comparing several options range from simple rankings based on voting to complicated evaluation methods based on matrices calculations. The challenge is to find the most appropriate methodology for an objectified evaluation of the comparison of two options available. Criteria for this are:
Fast comparison
Simple, uncomplicated procedure
Little to no training time
Any number of people
After a brief comparison of the evaluation methods based on the criteria mentioned, the very widespread and well-known utility value analysis turns out to be the method of choice here. Why? Because it is an uncomplicated and simple way of comparing options on the basis of various criteria without the need for a great deal of mathematical effort. In the utility value analysis, the variants are evaluated with a score using weighted criteria, the weighting and score are multiplied together and all the evaluations for an option are added up (see example).
Figure 2: Evaluation of the individual variants in a utility value analysis
This procedure should be familiar to almost everyone and is also used in practice in many areas. In addition to the evaluation by the person giving the score, there is a potential source of subjective error: the weighting of the criteria. Since score allocation cannot be made more objective, a way of calculating the weighting objectively must be found. This is absolutely essential if a meaningful utility value analysis is required. Objective weighting ensures that no “mindless” decisions are made, e.g. due to time pressure, and that the weighting is as independent of the observer as possible.
Procedure for calculating weighting
As with the utility value analysis, the procedure should be uncomplicated, quick and require no training. Under these premises, two procedures in particular emerge, which are briefly explained in the following below.
Graduated weighting
In the graduated weighting calculation, all criteria are compared with each other in terms of their importance. Thereby, the scale comprises five gradations from -2: “significantly lower importance” to 2: “significantly higher importance”. This granular assessment must therefore be made for each pairing of criteria. The weighting is then calculated using a method similar to matrices calculation.
Figure 3: Example of a scale with graduated weighting
Priority weighting
Here, the granular evaluation is dispensed with and a distinction is only made between “more important” and “less important”. Thus, each criterion is compared with each other and the more important one is noted in the table. The relative proportion of the number of a criterion is then used to determine the weighting. This procedure can be integrated well in a team, because after the ranking by the individuals, all results can be combined and thus a representative weighting is obtained.
Figure 4: Example of priority weighting of individual criteria
When is which procedure suitable?
In principle, any weighting procedure can be used in any situation. However, the following table gives indications for which calculation method can be advantageous in which circumstances.
Graduated weighting
Priority weighting
Low number of criteria
High number of criteria
Low number of evaluating persons
High number of evaluating persons
Sufficient time available
Little time available
Especially important decision
In summary, it can be said that the procedure of graduated weighting is often too labour-intensive if one assumes in practice that decisions are sometimes not even accompanied by a representative evaluation procedure. Priority weighting, on the other hand, is an uncomplicated option that can be quickly understood and also implemented in a team and is therefore particularly recommended.
In addition to the utility value analysis, other methods and indicators can be used to compare variants, such as standard deviation, number of gains/losses, etc., which should make the final decision easier, but which are not part of this article.