Appium – An Introduction (Part 1)

Introduction

In the following three blog articles, I would like to present Appium to you: a test automation tool which was developed especially for testing mobile applications. Appium offers us the possibility to simulate specific mobile application scenarios e.g.: gesture control, SMS or incoming calls and to automate corresponding test cases. Apart from virtual devices, Appium offers us the possibility, as an additional feature, to perform automated test cases on real mobile devices.

Why automate on mobile devices?

But why should we run our test automation on real devices? Why not use the virtual devices from the development tools Xcode (iOS) and Android Studio (Android)? These questions are justifiable, because the acquisition of end devices generates additional costs.

The first argument for automation on real end devices may sound trivial but is of great significance: due to the fact that your users do not utilize any virtual devices.

One could assume that virtual devices reflect one-to-one real end devices. But this assumption is wrong. The main reason is that virtual devices don’t have any hardware of their own. They use the hardware of the computer on which they are installed. Experience shows also that errors which were found on a real end device could not always be replicated reliably on virtual devices.

In addition, automation on real end devices enables you to examine the performance of your application. Even if all the features of your application work perfectly, bad performance on the end device may result in your application being unusable. Tests on virtual devices provide us with no reliable data regarding this matter.

The problem of hardware and software fragmentation can also be seen as an argument for the automation on real end devices.

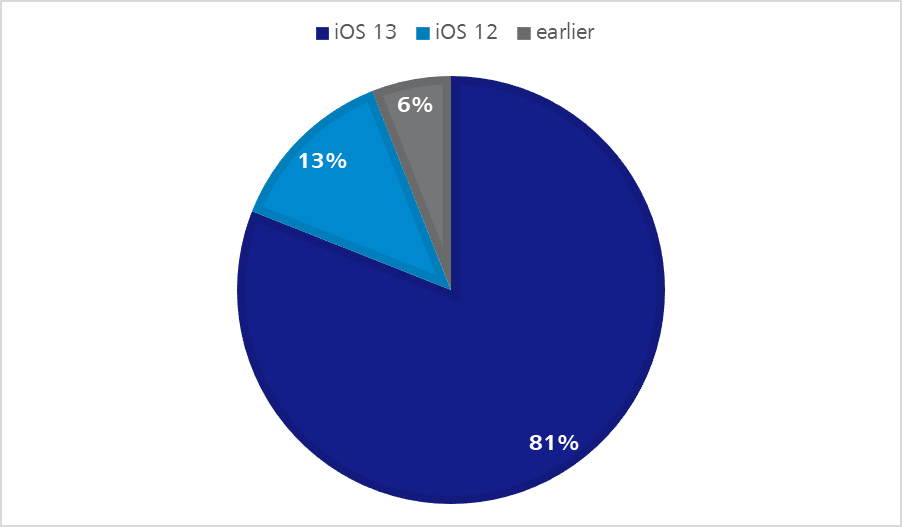
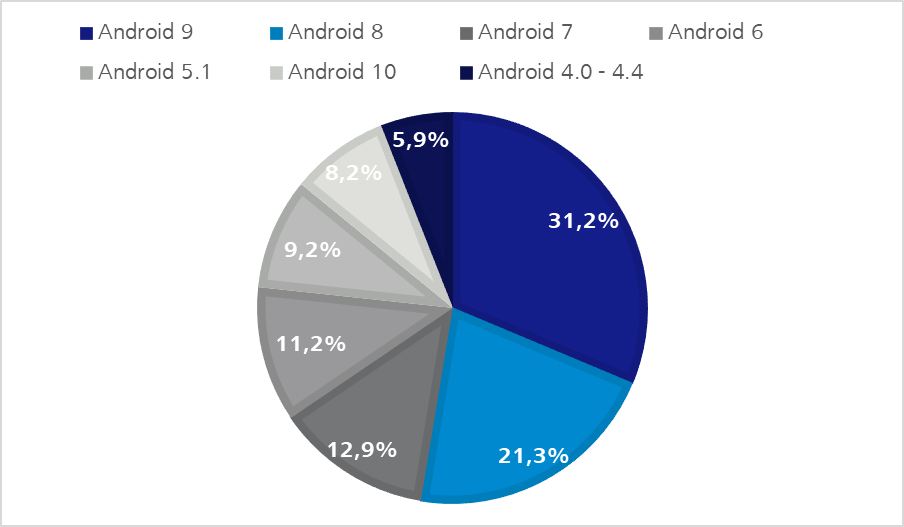
With regard to iOS as well as Android devices due to an ever-increasing product range, as well as operating system versions which remain longer and longer in circulation, a kind of natural fragmentation is developing – as shown in the following statistics.

diagram showing iOS distribution
Figure 1: iOS distribution on Apple devices – Q2 2020 | https://developer.apple.com/support/app-store/
diagram showing android OS distribution
Figure 2 – Android OS distribution – Q2 2020 | https://9to5google.com/2020/04/10/google-kills-android-distribution-numbers-web

Regarding Android devices we can observe another software fragmentation. The manufacturers are able to change the Android operating system within certain parameters. So system apps, like the virtual keyboard, can operate with varying results.

Let’s take the Gboard from Google and the virtual keyboard OneU from Samsung as examples. Both support swipe-control elements or the input of gestures, but they differ in the execution.

Google‘s virtual keyboard shows you the word, which is being formed while you glide over the keyboard. Whereas Samsung’s keyboard on the other hand shows you the word only when your fingers have stopped gliding.

One should not assume that the virtual devices from xCode or Android Studio simulate those differences.

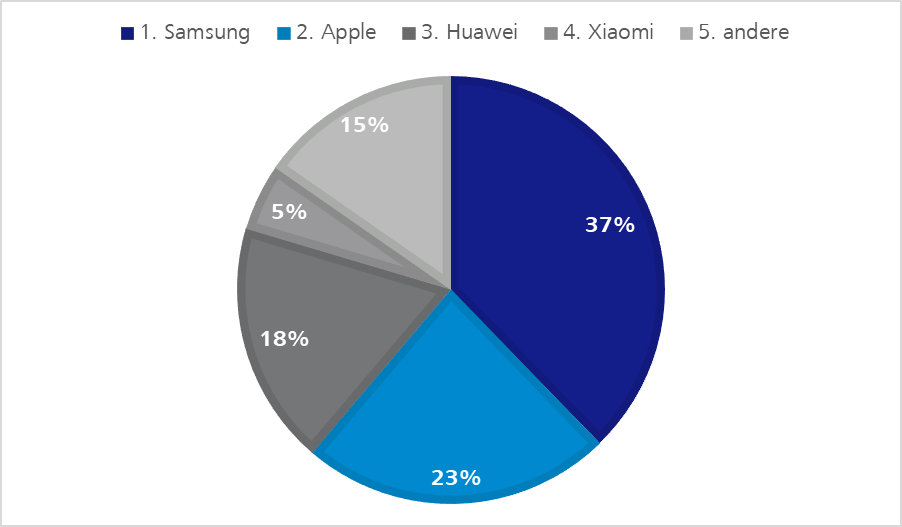
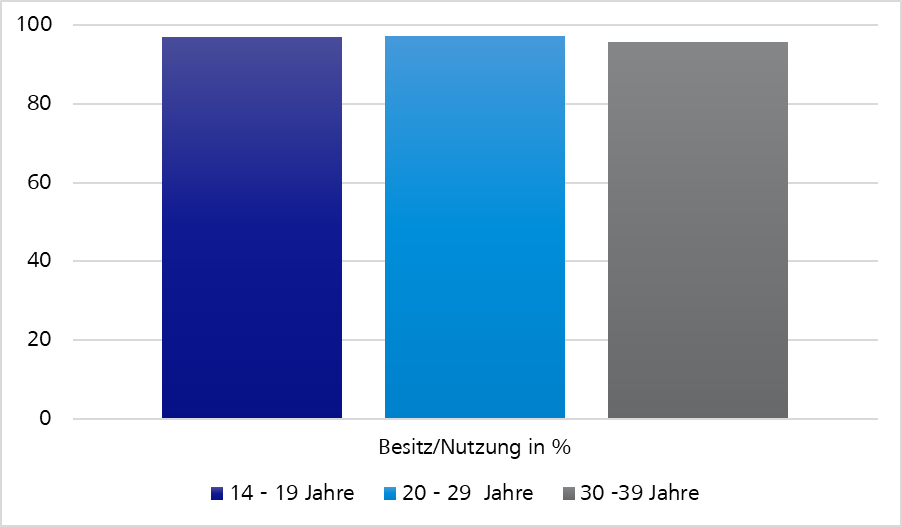
Of course, we cannot establish an infinitely large pool of mobile end devices. However, we can make a selection of devices which are strongly represented by their users.

End devices by Apple, Samsung and Huawei surely play a more decisive role in the pool than equipment constructed by other manufacturers as the following statistics show.

diagram showing manufacturers' market share Germany
Figure 3: Manufacturers’ market share Germany Q2 2020 | de.statista.com
diagram showing manufacturers' market share USA
Figure 4: Manufacturers’ market share USA Q2 2020 | https://www.canalys.com/newsroom/canalys-us-smartphones-shipments-Q2-2020

Issue – test automation tool fragmentation

Having gone into the advantages of test automation on real end devices, of course this still raises the fundamental question for projects with an existing test automation: Why should Appium be introduced as an additional test automation tool?

The problem of software fragmentation can be observed also in test case automation. There are more and more tools which support certain functions and settings, but are only conditionally compatible with each other. Ideally, we would like to utilize only one single test automation tool in order to reduce the obstacles of test case automation.

To answer the last question, let‘s start from the perspective of a multi-platform project.

Our application has been programmed as a desktop website, native iOS app and hybrid Android app. Additionally, we have created a responsive web app because your website already has good coverage of automated test cases via Selenium.

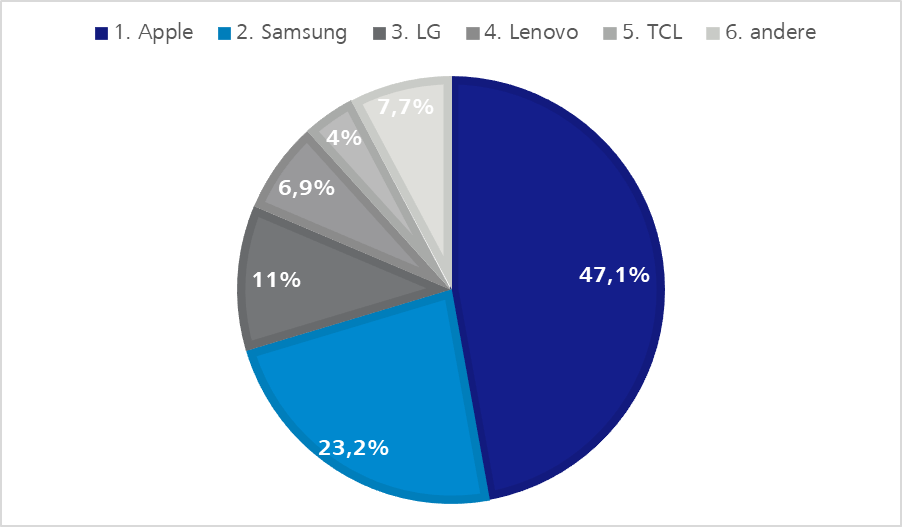
The following statistics indicate that test case automation which is merely limited to the website concerned is no longer sufficient for our multi-platform project.

diagram showing possession and use of smartphones according to age groups
Figure 5: Possession and use of smartphones according to age groups in Germany 2019 | de.statista.com
diagram of revenue comparing AppStore and PlayStore
Figure 6: Revenue from mobile stores in bn. US$ | https://sensortower.com/blog/app-revenue-and-downloads-1h-2020

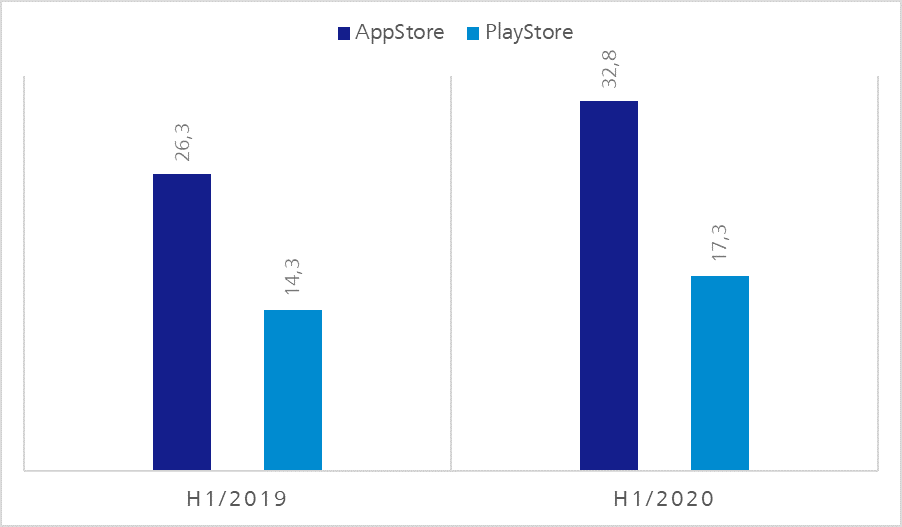
We should assume that all relevant target groups also use our application on mobile end devices.

Appium vs. Selenium

A short look back to the origins of test automation tools shows why the introduction of further tools is useful regarding our example.

The first applications for which the test cases on end devices were automated were websites, amongst other things. Due to there being an increase of browsers the automation of test cases even in the front end area became necessary.

One of the most successful test automation tools in this area is Selenium. According to the origins, however, Selenium is geared towards the test case automation of websites. Mobile-specific use cases as gesture control are no longer being supported.

But let us assume that in our multi-platform project only a small number of users utilize the mobile applications. The majority use the desktop website and this has, as we know, a good automated test case coverage via Selenium.

Is the introduction of Appium still worthwhile?

Having briefly explained the problem of tool fragmentation, the introduction of Appium may possibly be connected more with costs rather than benefits. One could suppose our teams, which are experienced in Selenium automation, could automate the most important test cases with Selenium, and a few workarounds for our mobile applications. But let‘s take a closer look at Appium to check whether this claim is true.

Automation of mobile specific application scenarios using Appium

Let us first take a look at the problem of mobile specific application scenarios. Let’s contemplate use cases which Appium supports, where difficulties surely will occur for our test-automation experts using Selenium.

Gesture control

In our application a list exists whose end our users would like to reach. In the desktop-browser version, the users certainly utilize the mouse wheel, the scroll bar or the arrow keys on the keyboard for this. In the mobile applications, however, they will fall back on diverse gestures in order to reach the end of the list. They could put their finger on the lower screen area, hold it, pull it upwards and release it again just to move a certain part of the list.

Another possibility would be to place the finger at the bottom of the screen and with a quick upward-swipe gesture trigger an automatic scroll-down. For these cases we could fall back on TouchAPI by Appium.

Calls and SMS

Incoming calls and SMS have a much heavier impact on use of our application on mobile end devices. While on the desktop, the call usually only opens another window, the running application on mobile end devices is interrupted most of the time and the respective application for telephone calls is summoned to the foreground. Furthermore, incoming SMS usually trigger a notification via the current application. For these cases we can fall back on the phone-call API from Appium.

System applications

On mobile end devices our application probably comes much more often in contact with system applications. Be it the calendar, the photo gallery or the in-house map application. Appium also offers us at this point – regardless of which Appium driver we use – the possibility to integrate these system applications into our test automation.

Automation of hybrid apps

Now let’s take a look at the tool fragmentation issue in test case automation.

One part of the problem consists of the various types of development in mobile applications. In our example project the most common types are represented.

Let’s take a closer look at how Appium deals with the more complex hybrid applications via the Context API.

To find elements, or to interact with them, Appium assumes by default that all our commands refer to native UI-components which are displayed on the screen. Our test session is therefore still in the so-called Native Context.

If we use, for example, the Appium command getPageSource within the framework of a hybrid application, we will find in the output regarding web views only elements like <XCUIElementType…>. Important elements such as Anchor Tags or Divs are not shown to us at this stage.

So as long as we move in the Native Context all web views, or so-called Web Context are a black box for Appium. Although we are able to discern Web View UI-elements, and eventually even some buttons which for example iOS implies. However, it will not be possible to discern elements on the basis of CSS-Selectors.

To get better access to the Web Context, we need to transfer our Appium Session into the Web Context. This we can do by first discerning the name of the Web Contexts with the command driver.getContextHandles. This displays an array of all context names which Appium has created to assign them to the available Context. In our case the output is a Web Context called WebView1 and a Native Context called NativeElement1.

Now to transfer our Appium session into the Web Context we use the command driver.setContext(WebView1). When this command has been executed Appium uses the Context environment which corresponds to the specified Context.

All other commands now operate within the Web Context and relate to WebView1. To be able to address again the native element we use the same command once more with the name of the Native Context which we would like to address. So in our case: driver.setContext(NativeElement1). If we would like to find out in which Context we actually are we could use the following command: String currentContext = driver.getContext();

After briefly discussing the Context API from Appium, let’s take a look at how it works.

On iOS, Appium uses the so-called „remote Debugger Protocol“ which is supported by Safari. This „remote Debugger Protocol“ enables us to receive information about the sites displayed in Safari, or to control browsing behavior. One method we can fall back on is the possibility to paste the current website into JavaScript.

Appium uses this function to perform all commands available in the WebDriver API.

Support of code languages

Appium allows you to write tests in different code languages. This is an advantage of the client-server model. The Appium development team is able to implement all Appium functions in only one server code base, which is written in JavaScript (Appium Server = NodeJS platform). Nevertheless, users who write codes in another programming languages are able to get access to these functions. The access takes place via the Appium client libraries, which Appium provides us with. If, for example, we would like to write our automatic tests in Java, we need to integrate the corresponding Appium Java Libraries into our Appium Client.

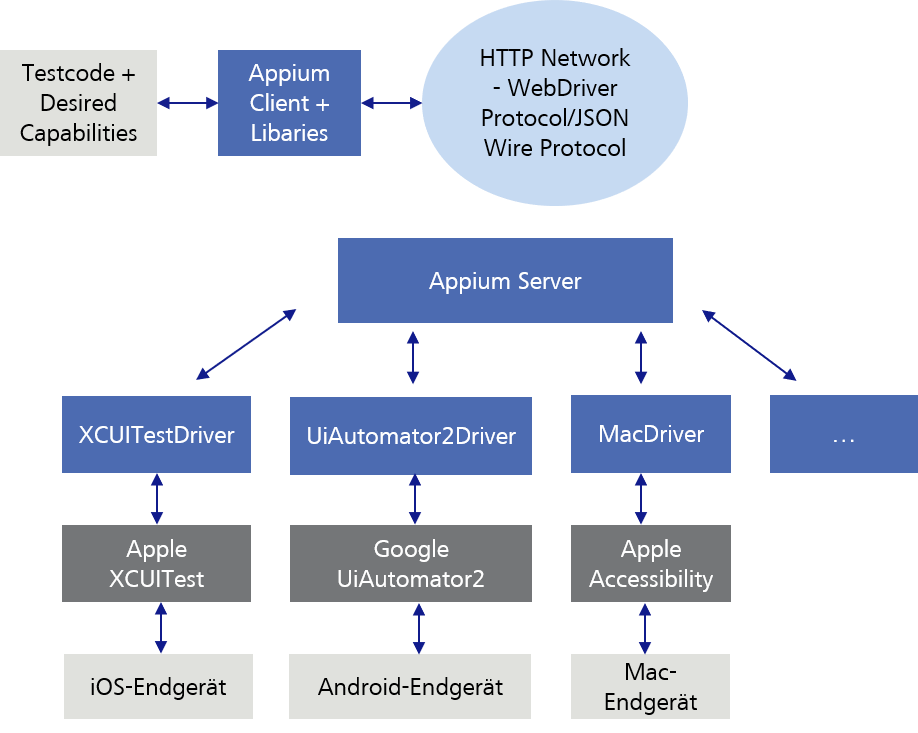
Appium client server model

As already described, we send our test code (commands/requests) via the Appium Client with the corresponding libraries to the Appium server. As Appium Client for example the developer tool Eclipse can be used. The Appium Server again sends our test code (commands/requests) to the mobile end device, on which this is then executed. But let’s go into more detail.

In order that the Appium Server can interpret the Appium Client test code (commands/requests), it uses the WebDriver Protocol, or the older JSON Wire Protocol, which convert our test code to a HTTP RESTful request.

Afterwards, the Appium Server sends our test code depending on which end device we would like to address to the platform-specific test framework which in turn executes the test code on the end device. At this point, the Appium Server is able to communicate with the different test frameworks.

In order that the Appium Server can decide with which of those platform-specific test frameworks, or with which end device it should communicate, our test code has to be sent along with the so-called „Desired Capabilities“ as JSON Object to the Appium Server. In the Desired Capabilities, for example, we specify the device name, the platform (iOS, Android…) and the platform version.

visualization of appium client-server model
Figure 7: Appium client-server model

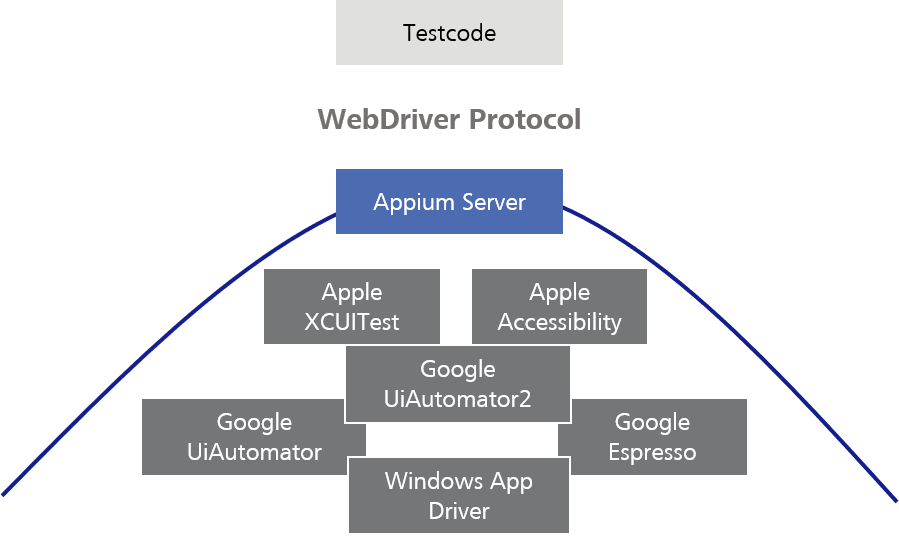
There is not necessarily only one test framework per platform. For example, under Android there are three different automation technologies by Google. The oldest one, UiAutomator, was replaced by UiAutomator2. UiAutomator2 has added a variety of new automation functions.

The latest test framework is called Espresso, and works with a totally different model than UiAutomator2. However, it offers much greater stability and test speed.

You can instruct your Appium tests to refer to one of those test frameworks, based on their specific functions and the platform support.

Theoretically, you could also use the test frameworks directly. However, Appium offers a practical setting for the different test frameworks, providing them with the same WebDriver Protocol and tries to balance behavioral differences between various test frameworks.

Figure 8: Appium as setting for test frameworks

When new test frameworks appear, the Appium team can create a communication protocol (Driver) for them so you can access these without having to rewrite all your test scripts. This is the strength of using a standard protocol and the Client-Server-Architecture.

It also enables cross-platform automation. Instead of learning two different test frameworks in two different languages, in most cases you could write one Appium-Script and run it on different platforms.

Whoever uses Appium does not need to know much about these underlying test frameworks, because they only deal with the Appium API and for example, do not need to write an XCUI test or an Espresso test.

Summary

In summary, we can say: Appium is a tool for automation of mobile applications which was inspired by Selenium. In fact, Appium tests are based on the same protocol as Selenium tests. Selenium offers their users the possibility to control web browsers. For historical reasons, it is sometimes called „WebDriver“ or „Selenium/WebDriver“.

As you may have already recognized by the name Appium, it was designed to be as compatible as possible with Selenium. Appium adopted the same protocol as Selenium, so that Appium and Selenium tests mostly look the same and „feel” the same. In fact, the Appium Client Libraries were constructed using Selenium Client Libraries as its basis.

But there was a problem: The Selenium Protocol was only developed for the automation of web browsers. Therefore, Appium had to add commands to the protocol to enable mobile-specific automation. This means that Appium commands are an extension of Selenium ones.

The previously made claim, that the introduction of Appium in our example project, would not be useful due to the cost-benefit factor is therefore wrong. It can even be assumed, that besides an improved coverage regarding the test automation, the introduction could also contribute to an improvement of the process.

I hope you have enjoyed this short excursion into the world of test automation and the technical background of Appium. In my second blog regarding Appium, I will show you how to set it up. In addition, I will demonstrate, using specific code examples as a basis, what we are able to achieve using Appium in our multi-platform project. There we will discuss the already addressed cases. I would be happy to welcome you to my next post in this blog series.

Until then, happy testing.

Pimp my testAUTOmation (Part 3)

Result protocols and reports

With Selenium, as with most test automation tools, result reports can be generated. These machine-readable documents in formats such as XML or JSON are not very user-friendly, but they can be easily integrated into other tools and thus made more readable. With this blog series I want to show how important functions in Selenium can be extended or enhanced with simple means. In the first part I introduced what Selenium 4 brings and how screenshots can be used. In the second part we made a video of the test and the third part is about reports. I try to evaluate the approaches according to their added value (The Good) and their challenges (The Bad) and give useful hints (… and the Useful) if necessary.

Why do we need reports?

To answer the “why” question, I start with the “worst” case: The evaluation and audit-proof storage of all test results is mandatory in some projects, because legal or other requirements must be met. In the case of contract development, this may be a requirement of the customer. In the case of software and hardware development in the medical field, it is a mandatory requirement for approval and licensing by the authorities. But even without these specifications, reports and clear protocols offer added value for the project. They can be used to derive key figures and trends that the team needs for its retrospectives or further development.

Just a protocol…

There are many ways to generate simple machine-readable test protocols. When using automated tests (Selenium, JUnit) in Java projects, you can use Maven to integrate the maven-surefire plugin, which creates an XML file during the build process that records the results of a test run. The XML file contains the name of the test class and all test methods, the total duration of the test execution, the duration of each test case / method and the test results (tests, errors, skipped, failures).

… and what do you do with it.

The machine-readable logs are usually generated automatically in the build tool and included in the result report of the build tool. Thus, Jenkins includes all results of automated testing for projects organized with Maven. In addition, most build tools have plug-ins that include the test logs or even graphically display them.

The projects that need to document all of their test results usually face the problem that the test results for the different types of tests (manual, automated, etc.) are generated in different tools and therefore exist in different formats. Therefore, different test management tools offer the possibility to read in the machine-readable reports. This means that the test results of the automated tests stand next to the manual tests and can be summarized in a test report/test report.

For example, in the Jira test management plug-in Xray, the test results for JUnit and NUnit can be imported manually or automatically via a Rest API: https://confluence.xpand-it.com/display/public/XRAY/Import+Execution+Results.

Is there more to it?

If no suitable test management tool is available or if you need a stand-alone version, I would like to introduce the Allure Test Report tool. The Allure framework is a flexible, lightweight and multilingual test report tool with the possibility to add screenshots, protocols etc. It offers a modular architecture and clear web reports with the possibility to save attachments, steps, parameters and much more. Different test frameworks are supported: JUnit4, JUnit5, Cucumber, JBehave, TestNG, …

Screenshot Allure Report

To create better evaluation and clarity in the reports, the Allure framework uses its own annotations. This allows the results of test classes and test methods to be linked to features, epics or stories. Annotations such as @Story, @Feature or @Epic can be used to link test classes or test methods with requirements (story, epic, feature). These links can then be evaluated in the report view and statements about test coverage or project progress can be made.

Furthermore, the readability of the test cases can be improved by the annotation @Step and @Attachment. We can divide our test case (@Test) into individual test methods to increase readability and reusability. With the annotation @Step of the Allure framework, these test methods or test steps can be displayed in the test log. Here @Step supports the display of a test step description of the parameters used, the step results, and attachments. This is because test steps can have texts attached in the form of strings and images in the form of byte[]. See the code example …

Annotationen von Allure

import org.apache.commons.io.FileUtils;
import org.junit.jupiter.api.Test;
import org.junit.jupiter.api.AfterEach;
import org.junit.jupiter.api.BeforeEach;
import org.junit.jupiter.api.Assertions;
 
import org.openqa.selenium.*;
import org.openqa.selenium.firefox.FirefoxDriver;
 
import io.qameta.allure.Allure;
import io.qameta.allure.Feature;
import io.qameta.allure.Description;
import io.qameta.allure.Severity;
import io.qameta.allure.SeverityLevel;
import io.qameta.allure.Step;
import io.qameta.allure.Attachment;
import io.qameta.allure.Story;
import io.qameta.allure.Epic;
 
import java.io.File;
import java.io.IOException;
import java.text.SimpleDateFormat;
import java.util.Date;
import java.util.concurrent.TimeUnit;
 
/**
 * Allure Framework is a flexible lightweight multi-language test report tool
 * that not only shows a very concise representation of what have been tested
 * in a neat web report form, but allows everyone participating in the development
 * process to extract maximum of useful information from everyday execution of tests.
 *
 * https://docs.qameta.io/allure/#_junit_5
 */
@Feature("BMI Calculator")
public class TestAllureReportAttach {
 
    FirefoxDriver driver;
    String url = "https://60tools.com/en/tool/bmi-calculator";
 
    @Test
    @Description("BMI Calculator / Underweight / Male")
    @Severity(SeverityLevel.CRITICAL)
    @Story("calc BMI")
    public void testUnderWeightMale() {
        inputTestdata("20", "200", "20", "Männlich");
        clickButtonCalc();
        compareResult("5");
    }
 
    @Test
    @Description("BMI Calculator / Overweight / Male")
    @Severity(SeverityLevel.BLOCKER)
    @Story("calc BMI")
    public void testOverWeightMale() {
        inputTestdata("200", "100", "20", "Männlich");
        clickButtonCalc();
        compareResult("20");
    }
 
    @BeforeEach
    @Step("start FireFox and call page")
    public void startFirefoxWithURL() {
        /**
         * What is GeckoDriver?
         GeckoDriver is a connecting link to the Firefox browser for your scripts in Selenium.
         GeckoDriver is a proxy which helps to communicate with the Gecko-based browsers (e.g. Firefox), for which it provides HTTP API.
 
         Firefox's geckodriver *requires* you to specify its location.
         */
        System.setProperty("webdriver.gecko.driver", ".\\libs\\geckodriver.exe");
         
        driver=new FirefoxDriver();
        driver.get(url);
        driver.manage().timeouts().pageLoadTimeout(120, TimeUnit.SECONDS);
    }
 
    @Step("input: weight='{0}', size='{1}', age='{2}' und sex='{3}'")
    private void inputTestdata(String weight, String size, String age, String sex) {
         
        driver.findElement(By.name("weight")).sendKeys(weight);
        driver.findElement(By.name("size")).sendKeys(size);
        driver.findElement(By.name("age")).sendKeys(age);
 
         
        WebElement gender = driver.findElement(By.name("sex"));
        gender.sendKeys(sex);
        gender.sendKeys(Keys.RETURN);
    }
 
    @Step("click auf Calculate Body Mass Index")
    private void clickButtonCalc() {       
        WebElement button = driver.findElement(By.xpath("//*[@id=\"toolForm\"]/table/tbody/tr[5]/td[2]/input[2]"));
        button.click();
    }
 
    @Step("compare with result '{0}'")
    private void compareResult(String result) {
        String str2 = driver.findElement(By.xpath("//*[@id=\"content\"]/div[2]")).getText();
 
        System.out.println("str2: " + str2);
        attachment(str2);
 
        System.out.println("getScreenshot1");
        //make a screenshot
        screenShot(driver, ".\\screenshots\\" ,"test_Oversized");
        System.out.println("getScreenshot3");
 
        Assertions.assertTrue(str2.contains(result));
 
    }
 
    @AfterEach
    @Step("close")
    public void closeBrowser() {
        driver.close();
    }
 
    @Attachment(value = "String attachment", type = "text/plain")
    public String attachment(String text) {
        return "<p>" + text + "</p>";
    }
 
    @Attachment(value = "4", type = "image/png")
    private static byte[] screenShot(FirefoxDriver driver, String folder, String filename) {
 
        SimpleDateFormat dateFormat = new SimpleDateFormat("yyyyMMdd_HHmmss");
        String timestamp  = dateFormat.format(new Date());
 
        try {
            File scrFile = ((TakesScreenshot)driver).getScreenshotAs(OutputType.FILE);
            // Now you can do whatever you need to do with it, for example copy somewhere
            FileUtils.copyFile(scrFile, new File(folder + filename + "_" + timestamp + ".png"));
            return driver.getScreenshotAs(OutputType.BYTES);
        }
        catch (IOException e) {
            System.out.println(e.getMessage());
        }
        System.out.println("getScreenshot2");
        return new byte[0];
 
    }
 
}

… and the result in the test protocol:

screenshot results from test protocol in Allure

Conclusion

With test protocols and reports, automated test runs can be generated very easily and integrated into your own tool chain. Although this is usually associated with a little extra work, trends and problems can be identified faster and better.

Result protocols and reports

The GoodThe Bad… and the Useful
• Visualization of the current status
• Trends and problems can be identified

• More effort
• New tools and interfaces
• Higher complexity

• Allure Test Report → allure.qatools.ru/
• Xpand Xray → getxray.app/
• Plugins in build tools

Pimp my testAUTOmation (Part 2)

Record videos of the test procedure

With this blog series I want to show how important functions can be built into selenium by using simple means. In the first part I introduced what Selenium 4 brings and how to use screenshots. In the second part we will create a video of the test execution. I try to evaluate the approaches according to their added value (The Good) and their challenges (The Bad) and to give useful hints (… and the Useful).

Why?

But at the beginning we will briefly ask ourselves the question: Why record a video or screencast of the test performance?

With a video we have a recording of the entire test run. Unlike with a screenshot, we can not only record the test result, but we can also trace the path to it.

Like screenshots, the videos can also be used for debugging and point out problems during the test run. Therefore, as with the screenshot, it makes sense to create videos only when problems occur. Following this approach, the video functionality should be extended by a flexible and global switch that can be set as needed.

But the videos can also be used to document the test results. In some projects a detailed documentation is even mandatory, because here legal or other requirements have to be met.

Recording video made easy

Since I use Java Selenium, my first approach was to record videos with the “in-house” functions of Java or to use a suitable framework. My first choice was the MonteCC framework, because it allowed me to record the screen during the test execution with the help of only two methods. In one method video recording is started before the test and in one method the recording is stopped after the test and the video is stored in the appropriate directory.

private ScreenRecorder screenRecorder;
 
@BeforeEach
public void beforeTest() {
 
    GraphicsConfiguration gc = GraphicsEnvironment
            .getLocalGraphicsEnvironment()
            .getDefaultScreenDevice()
            .getDefaultConfiguration();
 
    try {
        this.screenRecorder = new ScreenRecorder(gc,
                new Format(MediaTypeKey, MediaType.FILE, MimeTypeKey, MIME_AVI),
                new Format(MediaTypeKey, MediaType.VIDEO, EncodingKey, ENCODING_AVI_TECHSMITH_SCREEN_CAPTURE,
                        CompressorNameKey, ENCODING_AVI_TECHSMITH_SCREEN_CAPTURE,
                        DepthKey, 24, FrameRateKey, Rational.valueOf(15),
                        QualityKey, 1.0f,
                        KeyFrameIntervalKey, 15 * 60),
                new Format(MediaTypeKey, MediaType.VIDEO, EncodingKey,"black",
                        FrameRateKey, Rational.valueOf(30)),
                null);
        this.screenRecorder.start();
 
    } catch (Exception e) {
        System.out.println("screenRecorder.start " + e.getMessage());
    }
}
 
@AfterEach
public void afterTest()  {
 
    try {
        this.screenRecorder.stop();
        List createdMovieFiles = screenRecorder.getCreatedMovieFiles();
        for (Object movie: createdMovieFiles) {
            File m = (File)movie;
            System.out.println("New movie created: " + m.getAbsolutePath());
        }
 
    } catch (IOException ioe) {
        System.out.println("screenRecorder.stop " + ioe.getMessage());
    }
}

To make sure this happens before each test, we use the annotations of JUnit:

@Test

The method with the annotation @Test is a test case and is started during test execution and the result is recorded in the test log.

@BeforeEach

This method is called before each test execution (see @Test).

@AfterEach

This method is called after each test execution (see @Test).

If you need a complete record of all test cases, you can also use the annotations @Before and @After, which are called before all or after all tests of an execution definition (test class).

Major disadvantages of MonteCC are that the last release was more than six years ago and that the videos are in QuickTime format.

JavaCV (https://github.com/bytedeco/javacv) offered itself as an alternative. The library is actively maintained in GitHub and stores videos in MPEG format. Again, there are two methods of video creation that can be called before and after the test. But JavaCV requires additional methods because screenshots are taken at short intervals parallel to the test run and then assembled into a video after the test. A detailed instruction can be found under the following link: https://cooltrickshome.blogspot.com/2016/12/create-your-own-free-screen-recorder.html.

I have made the following changes for use in automated testing:

/**
 *
 * https://github.com/bytedeco/javacv
 * https://cooltrickshome.blogspot.com/2016/12/create-your-own-free-screen-recorder.html
 */
public class RecordSeleniumJavaCV {
 
    // The WebDriver is a tool for writing automated tests of websites.
    FirefoxDriver driver;
 
    public static boolean videoComplete=false;
    public static String inputImageDir= "videos" + File.separator + "inputImgFolder"+File.separator;
    public static String inputImgExt="png";
    public static String outputVideoDir= "videos" + File.separator;
    public static String outputVideo;
    public static int counter=0;
    public static int imgProcessed=0;
    public static FFmpegFrameRecorder recorder=null;
    public static int videoWidth=1920;
    public static int videoHeight=1080;
    public static int videoFrameRate=3;
    public static int videoQuality=0; // 0 is the max quality
    public static int videoBitRate=9000;
    public static String videoFormat="mp4";
    public static int videoCodec=avcodec.AV_CODEC_ID_MPEG4;
    public static Thread t1=null;
    public static Thread t2=null;
    public static boolean isRegionSelected=false;
    public static int c1=0;
    public static int c2=0;
    public static int c3=0;
    public static int c4=0;
 
    /**
     * Explanation:
     * 1) videoComplete variables tells if user has stopped the recording or not.
     * 2) inputImageDir defines the input directory where screenshots will be stored which would be utilized by the video thread
     * 3) inputImgExt denotes the extension of the image taken for screenshot.
     * 4) outputVideo is the name of the recorded video file
     * 5) counter is used for numbering the screenshots when stored in input directory.
     * 6) recorder is used for starting and stopping the video recording
     * 7) videoWidth, videoFrameRate etc define output video param
     * 8) If user wants to record only a selected region then c1,c2,c3,c4 denotes the coordinate
     *
     * @return
     * @throws Exception
     */
    public static FFmpegFrameRecorder getRecorder() throws Exception
    {
        if(recorder!=null)
        {
            return recorder;
        }
        recorder = new FFmpegFrameRecorder(outputVideo,videoWidth,videoHeight);
        try
        {
            recorder.setFrameRate(videoFrameRate);
            recorder.setVideoCodec(videoCodec);
            recorder.setVideoBitrate(videoBitRate);
            recorder.setFormat(videoFormat);
            recorder.setVideoQuality(videoQuality); // maximum quality
            recorder.start();
        }
        catch(Exception e)
        {
            System.out.println("Exception while starting the recorder object "+e.getMessage());
            throw new Exception("Unable to start recorder");
        }
        return recorder;
    }
 
    /**
     * Explanation:
     * 1) This method is used to get the Recorder object.
     * 2) We create an object of FFmpegFrameRecorder named "Recorder" and then set all its video parameters.
     * 3) Lastly we start the recorder and then return the object.
     *
     * @return
     * @throws Exception
     */
    public static Robot getRobot() throws Exception
    {
        Robot r=null;
        try {
            r = new Robot();
            return r;
        } catch (AWTException e) {
            System.out.println("Issue while initiating Robot object "+e.getMessage());
            throw new Exception("Issue while initiating Robot object");
        }
    }
 
    /**
     * Explanation:
     * 1) Two threads are started in this module when user starts the recording
     * 2) First thread calls the takeScreenshot module which keeps on taking screenshot of user screen and saves them on local disk.
     * 3) Second thread calls the prepareVideo which monitors the screenshot created in step 2 and add them continuously on the video.
     *
     * @param r
     */
    public static void takeScreenshot(Robot r)
    {
        Dimension size = Toolkit.getDefaultToolkit().getScreenSize();
        Rectangle rec=new Rectangle(size);
        if(isRegionSelected)
        {
            rec=new Rectangle(c1, c2, c3-c1, c4-c2);
        }
        while(!videoComplete)
        {
            counter++;
            BufferedImage img = r.createScreenCapture(rec);
            try {
                ImageIO.write(img, inputImgExt, new File(inputImageDir+counter+"."+inputImgExt));
            } catch (IOException e) {
                System.out.println("Got an issue while writing the screenshot to disk "+e.getMessage());
                counter--;
            }
        }
    }
 
    /**
     * Explanation:
     * 1) If user has selected a region for recording then we set the rectangle with the coordinate value of c1,c2,c3,c4. Otherwise we set the rectangle to be full screen
     * 2) Now we run a loop until videoComplete is false (remains false until user press stop recording.
     * 3) Now we capture the region and write the same to the input image directory.
     * 4) So when user starts the recording this method keeps on taking screenshot and saves them into disk.
     *
     */
    public static void prepareVideo()
    {
        File scanFolder=new File(inputImageDir);
        while(!videoComplete)
        {
            File[] inputFiles=scanFolder.listFiles();
            try {
                getRobot().delay(500);
            } catch (Exception e) {
            }
            //for(int i=0;i<scanFolder.list().length;i++)
            for(int i=0;i<inputFiles.length;i++)
            {
                //imgProcessed++;
                addImageToVideo(inputFiles[i].getAbsolutePath());
                //String imgToAdd=scanFolder.getAbsolutePath()+File.separator+imgProcessed+"."+inputImgExt;
                //addImageToVideo(imgToAdd);
                //new File(imgToAdd).delete();
                inputFiles[i].delete();
            }
        }
        File[] inputFiles=scanFolder.listFiles();
        for(int i=0;i<inputFiles.length;i++)
        {
            addImageToVideo(inputFiles[i].getAbsolutePath());
            inputFiles[i].delete();
        }
    }
 
    /**
     * Explanation:
     * 1) cvLoadImage is used to load the image passed as argument
     * 2) We call the convert method to convert the image to frame which could be used by the recorder
     * 3) We pass the frame obtained in step 2 and add the same in the recorder by calling the record method.
     *
     * @return
     */
    public static OpenCVFrameConverter.ToIplImage getFrameConverter()
    {
        OpenCVFrameConverter.ToIplImage grabberConverter = new OpenCVFrameConverter.ToIplImage();
        return grabberConverter;
    }
 
    /**
     * Explanation:
     * 1) We start a loop which will run until video complete is set true (done only when user press stop recording)
     * 2) We keep on monitoring the input  Image directory
     * 3) We traverse each file found in the input image directory and add those images to video using the addImageToVideo method. After the image has been added we delete the image
     * 4) Using the loop in step1 we keep on repeating step 2 and 3 so that each image gets added to video. We added a delay of 500ms so that this module does not picks a half created image from the takeScreenshot module
     * 5) When user press stop recording the loop gets broken. Now we finally traverse the input image directory and add the remaining images to video.
     *
     * @param imgPath
     */
    public static void addImageToVideo(String imgPath)
    {
        try {
            getRecorder().record(getFrameConverter().convert(cvLoadImage(imgPath)));
        } catch (Exception e) {
            System.out.println("Exception while adding image to video "+e.getMessage());
        }
    }
 
    /**
     * Explanation:
     * 1) We make a JFrame with the button for staring and stopping the recording. One more button is added for allowing user to record only a selected portion of screen
     * 2) If user clicks to select only certain region then we call a class CropRegion method getImage which helps in retrieving the coordinate of the region selected by user and update the same in variable c1,c2,c3,c4
     * 3) If user clicks on start recording then startRecording method is called
     * 4) If user clicks on stoprecording then stopRecording method is called
     */
    @BeforeEach
    public void beforeTest() {
 
        System.out.println("this.screenRecorder.start()");
 
        SimpleDateFormat dateFormat = new SimpleDateFormat("yyyyMMdd_HHmmss");
        String timestamp  = dateFormat.format(new Date());
 
        outputVideo= outputVideoDir + "recording_" + timestamp + ".mp4";
 
        try {
            t1=new Thread()
            {
                public void run() {
                    try {
                        takeScreenshot(getRobot());
                    } catch (Exception e) {
                        System.out.println("Cannot make robot object, Exiting program "+e.getMessage());
                        System.exit(0);
                    }
                }
            };
            t2=new Thread()
            {
                public void run() {
                    prepareVideo();
                }
            };
            t1.start();
            t2.start();
            System.out.println("Started recording at "+new Date());
 
 
        } catch (Exception e) {
            System.out.println("screenRecorder.start " + e.getMessage());
        }
    }
 
    @AfterEach
    public void afterTest()  {
 
        System.out.println("this.screenRecorder.stop()");
 
        try {
            videoComplete=true;
            System.out.println("Stopping recording at "+new Date());
            t1.join();
            System.out.println("Screenshot thread complete");
            t2.join();
            System.out.println("Video maker thread complete");
            getRecorder().stop();
            System.out.println("Recording has been saved successfully at "+new File(outputVideo).getAbsolutePath());
 
        } catch (Exception e) {
            System.out.println("screenRecorder.stop " + e.getMessage());
        }
    }
 
    @Test
    public void testMe() {
         
        //toDo
 
    }
 
}

Is there a catch?

So, we now have several possibilities to record the automatic test run in a video in order to be able to reproduce it in case of problems or to fulfil the documentation obligations.

But recording during the test run is associated with a risk that the tester / test automator should keep in mind: It is an interference with the normal test run, because we might change the timing. Our modified test run with video recording may behave differently than a test run without video recording.

Videos of the test procedure

The GoodThe Bad… and the Useful
• Recording the entire test run
• In addition to the test result, the path to it can also be traced


• The test run is influenced
• Various old and paid frameworks for video recording
• Codec problems (QuicktimeView only)
• JavaCV →
github.com/bytedeco/javacv


Simple Case History of the QA Strategy for Agile Teams

We would like to present our agile visualization tool, the QA battle plan, a tool that allows agile development teams to recognize and eliminate typical QA issues and their effects.

Like a wrong architectural approach or using the wrong programming language, the wrong testing and quality assurance strategy can result in adverse effects during the course of a project. In the best case, it only causes delays or additional expenses. In the worst case, the tests done prove to be insufficient, and severe deviations occur repeatedly when the application is used.

Introduction

Agile development teams notice issues and document their effects in the Retrospectives, but they are often unable to identify the root cause, and therefore cannot solve the problem because they lack QA expertise. In such cases, the teams need the support of an agile QA coach. This coach is characterized on the one hand by his knowledge of the agile working method, and on the other hand by his experience in agile quality assurance.

The first step in the agile QA coach’s work is recording the status quo of the testing methods of the agile development team. For this purpose, he will use the QA battle plan, e.g. within the framework of a workshop. The QA battle plan provides a visual aid to the development teams which they can use to assess the planning aspects of quality assurance. Throughout the project, the QA battle plan can also be used as a reference for the current procedure and as a basis for potential improvements.

Anti-patterns

In addition, the QA battle plan makes it possible to study the case history of the current testing method. By means of this visualization, the agile QA coach can reveal certain anti-pattern symptoms in the quality assurance and testing process, and discuss them directly with the team. In software development, an anti-pattern is an approach that is detrimental or harmful to a project’s or an organization’s success.

I will describe several anti-patterns below. In addition to the defining characteristics, I will present their respective effects. As a contrast to the anti-pattern, the pattern—good and proven problem-solving approaches—will also be presented.

The “It’ll be just fine” Anti-pattern

This anti-pattern is characterized by the complete lack of testing or other quality assurance measures whatsoever. This can cause severe consequences for the project and the product. The team cannot make any statement regarding the quality of their deliverables, and consequently, they do not, strictly speaking, have a product that is ready for delivery. Errors occur upon use by the end user, repeatedly distracting the team from the development process because they have to analyze and rectify these so-called incidents, which is time-consuming and costly.

No testingEffectSolution
• There are no tests• No quality statement• “Leave quickly”
• Testing is done in the user’s environment• Introduce QA

The solution is simple: Test! The sooner deviations are discovered, the easier it is to remove them. In addition, quality assurance measures such as code reviews and static code analysis are constructive measures for consistent improvement.

The Dysfunctional Test Anti-pattern

ISO 25010 specifies eight quality characteristics for software: functional suitability, performance efficiency, compatibility, usability, reliability, security, maintainability, and portability. When new software is implemented, the focus is most often on functional suitability, but other characteristics such as security and usability play an important role today as well. The higher the priority of the other quality characteristics, the more likely a non-functional test should be scheduled for them.

Therefore, the first question to be asked at the start of a software project is: Which quality characteristics does the development, and therefore the quality assurance, focus on? To facilitate the introduction of this topic to the teams, we use the QA octant. The QA octant contains the quality characteristics for software systems according to ISO 25010. These characteristics also point to the necessary types of tests that result from the set weighting of the different functional and non-functional characteristics.

Functional tests onlyEffectSolution
• There are only functional tests• No quality statement about non-functional characteristics• Discuss important quality characteristics with the client
• It works as required, but…• Non-functional test types
• Start with the QA octant

The Attack of the Development Warriors Anti-pattern

Many agile development teams—especially teams that consist only of developers—only rely on development-related tests for their QA measures. Usually, they only use unit and component tests for this purpose. Such tests can easily be written with the same development tool and promptly be integrated in the development process. The possibility to obtain information about the coverage of the tests with respect to the code by means of code coverage tools is particularly convenient in this context. Certainty is quickly achieved if the code coverage tool reports 100% test coverage. But the devil is in the detail, or in this case, in the complexity. This method would be sufficient for simple applications, but with more complex applications, problems arise.

With highly complex applications, errors may occur despite a convenient unit test coverage, and such errors can only be discovered with extensive system and end-to-end tests. And for such extensive tests, the team needs advanced QA know-how. Testers or trained developers have to address the complexity of the application at higher levels of testing in order to be able to make an appropriate quality statement.

The attack of the development warriorsEffectSolution
• Development-related tests only• No end-to-end test• Include a tester in the team
• No tester on the team• Bugs occur with complex features• Test at higher levels of testing
• 100% code coverage• Quick

The “Spanish Option” Anti-pattern

The time in which a function has been coded and is integrated into the target system is becoming ever shorter. Consequently, the time for comprehensive testing is becoming shorter as well. For agile projects with fixed iterations, i.e. sprints, another problem arises: The number of functions to be tested increases with every sprint.

Plain standard manual tests cannot handle this. Therefore, testers and developers should work together to develop a test automation strategy.

Manual WorkEffectSolution
• There are only manual tests• Delayed feedback in case of errors• Everybody shoulders part of the QA work
• Testers are overburdened• Test at all levels of testing
• Introduce automation

The Automated Regression Gap Anti-pattern

A project without any manual tests would be the other extreme. Even though this means a high degree of integration in the CI/CD processes and quick feedback in case of errors, it also causes avoidable problems. A high degree of test automation requires great effort—both in developing the tests and in maintenance. The more complex the specific applications, and the more sophisticated the technologies used, the higher the probability of test runs being stopped due to problems occurring during the test run, or extensive reviews of test deviations being required. Furthermore, most automated tests only test the regression. Consequently, automated tests would never find new errors, but only test the functioning of the old features.

Therefore, automation should always be used with common sense, and parallel manual and, if necessary, explorative tests should be used to discover new deviations.

100% test automationEffectSolution
• There are only automated tests• Very high effort• Automate with common sense
• Everybody is overexerted• Manual testing makes sense
• Build stops due to problems

The Test Singularity Anti-pattern

Tests of different types and at different levels each have a different focus. Consequently, they each have different requirements regarding the test environment, such as stability, test data, resources, etc. Development-related test environments are frequently updated to new versions to test the development progress. Higher levels of testing or other types of tests require a steadier version status over a longer period of time.

To avoid possibly compromising the tests due to changes in the software status or a modified version, a separate test environment should be provided for each type of test.

One Test EnvironmentEffectSolution
• There is only one test environment• No test focus possible• Several test environments
• Compromised tests• By level of testing or test focus
• No production-related tests• “One test environment per type of test”

The “Manual” Building Anti-pattern

State-of-the-art development depends on fast delivery, and modern quality assurance depends on the integration of the automated tests into the build process and the automated distribution of the current software status to the various (test) environments. These functions cannot be provided without a build or CI/CD tool.

If there are still tasks to be done relating to the provision of a CI/CD process in a project, they can be marked as “to do” on the board.

No Build ToolEffectSolution
• There is no build tool• No CI/CD• Introduce CI/CD
• Slow delivery• Highlight gaps on the board
• Delayed test results
• Dependent on resources

The Early Adopter Anti-pattern

New technologies usually involve new tools, and new versions involve new features. But introducing new tools and updating to new versions also entail a certain risk. It is advisable to proceed with care, and not to change the parts/tools of the projects all at once.

Early AdopterEffectSolution
• Always the latest of everything…• Challenging training• No big bang
• Deficiencies in skills• Old tools are familiar
• New problems• Highlight deficiencies in skills on the board