Look Me in the Eyes – Application Monitoring with Azure Application Insights

With Application Insights, Microsoft provides an application monitoring service for development and DevOps. It can log virtually everything, from response times and rates to errors and exceptions, page impressions, users and user sessions, the back end, and desktop applications.

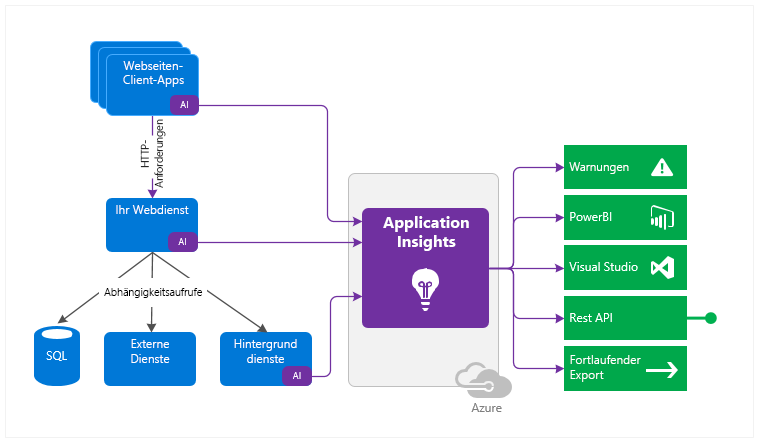
Monitoring is not restricted to websites, either. Application Insights can also be used with web services and in the back end. It can even monitor desktop applications. The data can then be analyzed and interpreted in various ways (see Figure 1).

Figure 1: Possible applications of Application Insights (Source: https://docs.microsoft.com/en-us/azure/azure-monitor/app/app-insights-overview)

Logging

As a starting point, you need an Azure subscription with an Application Insights instance. Once the latter has been set up, you will find the so-called Instrumentation Key in the overview, which functions as a connection string.

As soon as the instance has been provided, you can immediately start the implementation. In terms of programming, you are in no way limited to Azure resources or .Net. Microsoft supports a wide variety of languages and platforms.

We will use a small .Net Core console application as an example. All you have to do is integrate the NuGet package Microsoft.Applicationlnsights, and you can get started.

First, you create a Telemetry Client. Simply insert the corresponding Instrumentation Key from your own Application Insights instance, and just like that, the application is ready for the first log entries.

  • Trace generates a simple trace log entry with a corresponding message and appropriate severity level.
  • Events are appropriate for structured logs that can contain both text and numerical values.

Metrics, on the other hand, are numerical values only, and therefore used mainly to log periodic events.

  • Trace generates a simple trace log entry with a corresponding message and appropriate severity level.
  • Events are appropriate for structured logs that can contain both text and numerical values.
  • Metrics, on the other hand, are numerical values only, and therefore used mainly to log periodic events.
static void Main(string[] args)
{
Console.WriteLine("Schau mir in die Augen");

       var config = TelemetryConfiguration.CreateDefault();
       config.InstrumentationKey = "INSTRUMENTATIONKEY";
       var tc = new TelemetryClient(config);

       // Track traces
       tc.TrackTrace("BlogTrace", SeverityLevel.Information);

       // Track custom events
       var et = new EventTelemetry();
       et.Name = "BlogEvent";
       et.Properties.Add("Source", "console");
       et.Properties.Add("Context", "Schau mir in die Augen");
       tc.TrackEvent(et);

       // Track custom metric
       var mt = new MetricTelemetry();
       mt.Name = "BlogMetric";
       mt.Sum = new Random().Next(1,100);
       tc.TrackMetric(mt);

       tc.Flush();
}

As a side note, keep in mind that log entries appear in Application Insights with a delay of up to five minutes.

Interaction with NLog

Application Insights can also be integrated into an existing NLog configuration in a few simple steps.

You have to install the NuGet package Microsoft.Applicationlnsights.NLogTarget, and then add the following entries to the NLog configuration:

  • Add Extensions with reference to the Application Insights Assembly
  • New target of the Application Insights Target type (again specifying your own instrumentation key)
  • New rule targeting the Application Insights Target
<nlog xmlns="http://www.nlog-project.org/schemas/NLog.xsd"
      xmlns:xsi="http://www.w3.org/2001/XMLSchema-instance"
      throwConfigExceptions="true">

  <extensions>
    <add assembly="Microsoft.ApplicationInsights.NLogTarget" />
  </extensions>

  <targets>
    <target name="logfile" xsi:type="File" fileName="log.txt" />
    <target name="logconsole" xsi:type="Console" />
    <target xsi:type="ApplicationInsightsTarget" name="aiTarget">
      <instrumentationKey>INSTRUMENTATIONKEY</instrumentationKey>
      <contextproperty name="threadid" layout="${threadid}" />
    </target>
  </targets>

  <rules>
    <logger name="*" minlevel="Info" writeTo="logconsole" />
    <logger name="*" minlevel="Debug" writeTo="logfile" />
    <logger name="*" minlevel="Trace" writeTo="aiTarget" />
  </rules>
</nlog>

Analysis

The data are then analyzed by means of the Application Insights portal. All the logs can subsequently be found in the respective table under Logs (see Figure 2).

Figure 2: Analyses with Application Insights

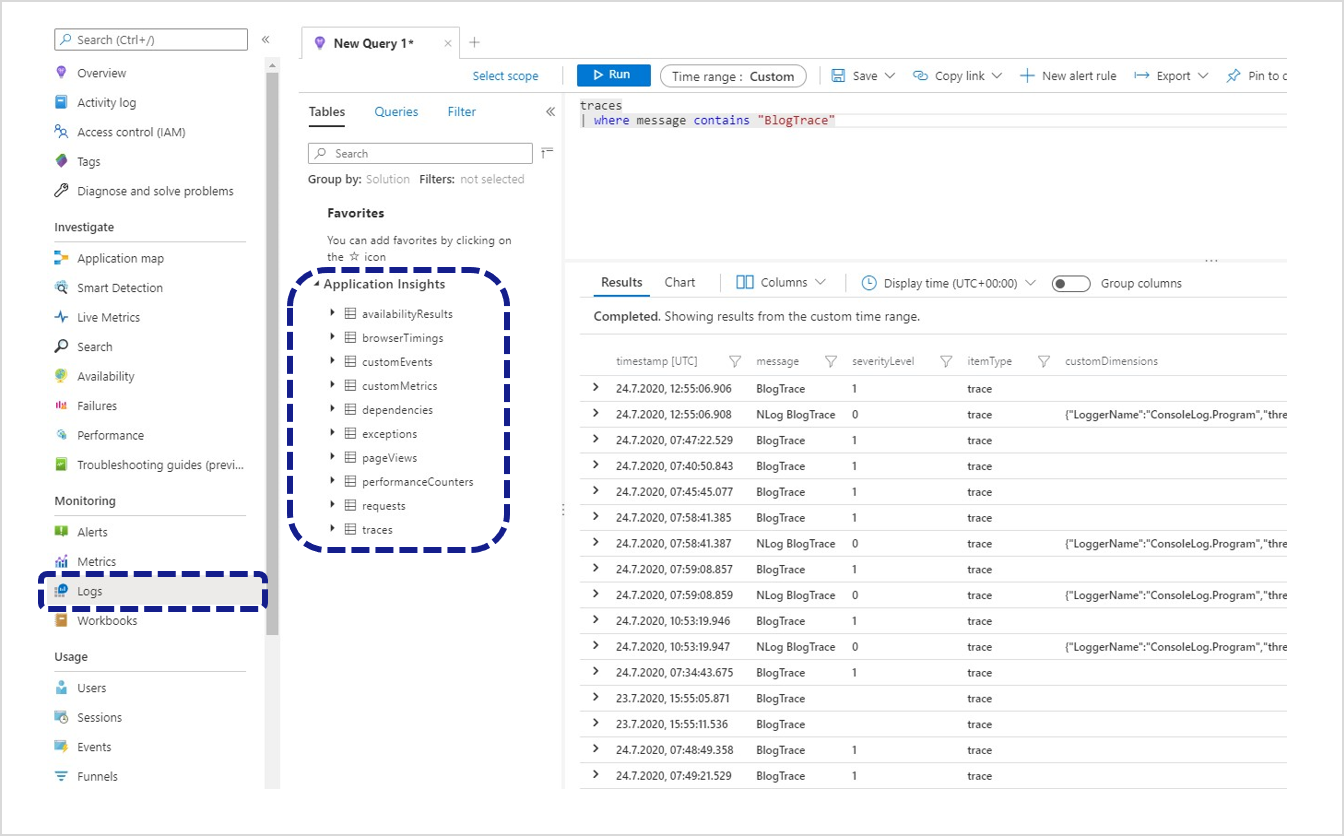
The trace logs created in the console application can be found in the traces table. Queries are phrased using the Kusto Query Language (KQL). The traces from the example above can be requested using the following query:

traces
| where message contains "BlogTrace"

The logged metrics can also be represented as a line chart using the following query (see Figure 3):

customMetrics
| where timestamp >= ago(12h)
| where name contains "Blog"
| render timechart 
Grafische Darstellung der geloggten Metriken
Figure 3: Graphic representation of the logged metrics

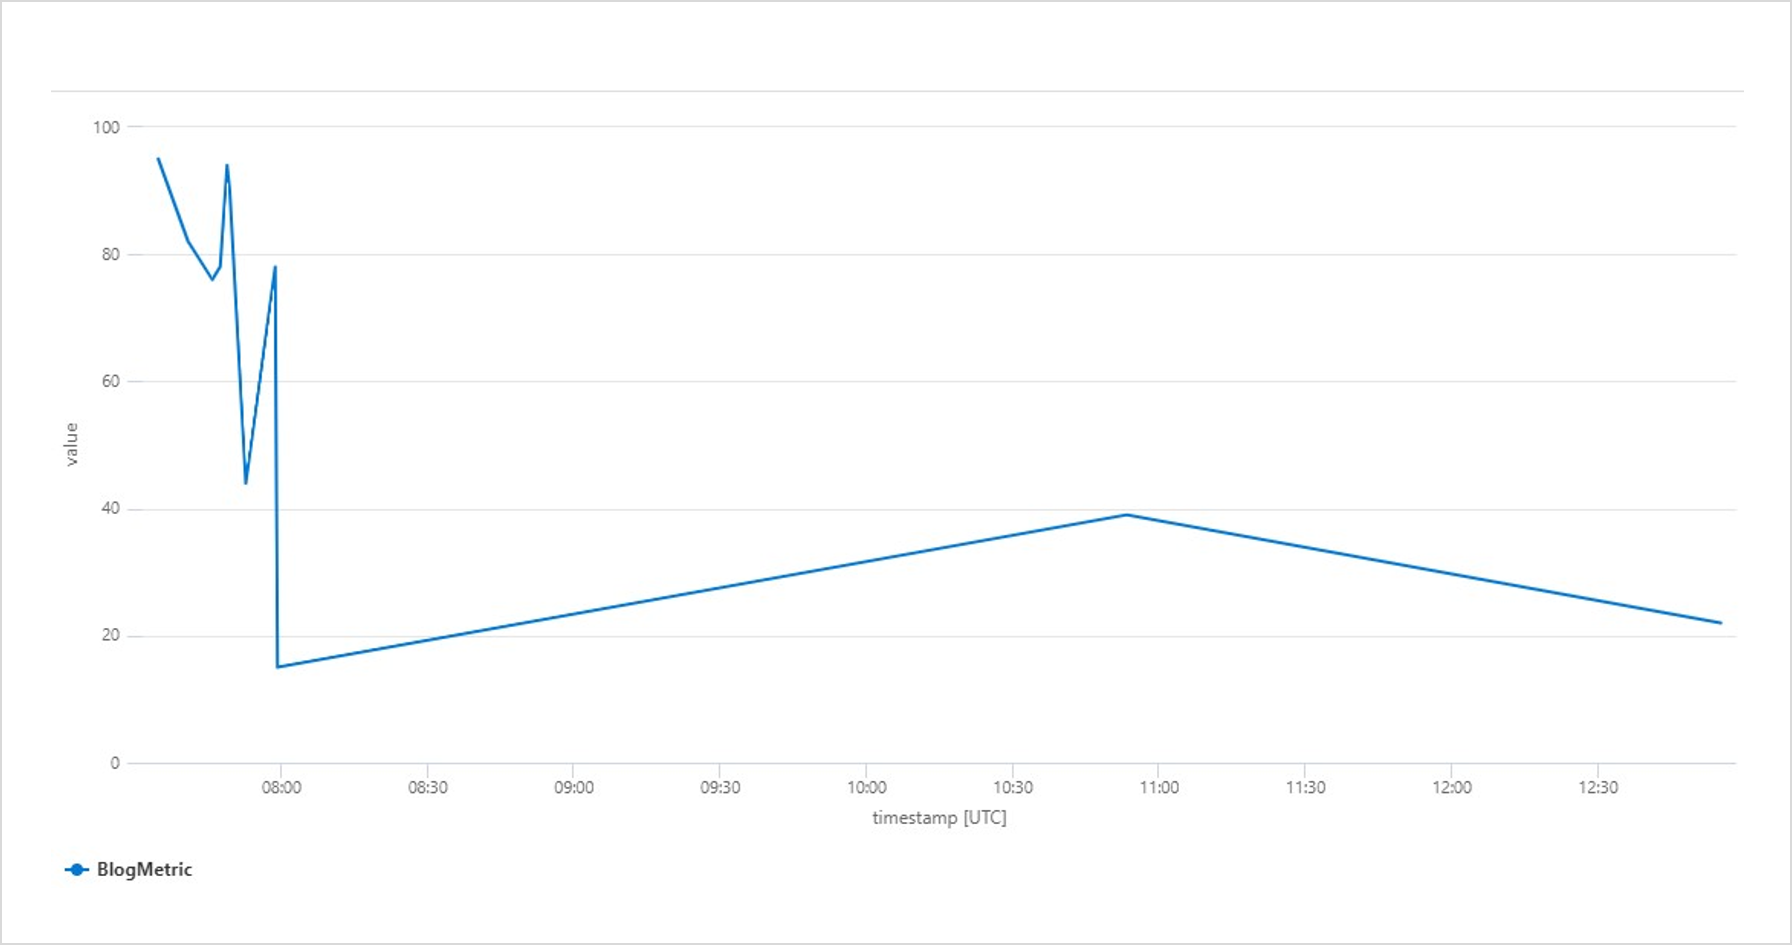
Dashboards & alert rules

To identify irregularities at an early stage, you can create customized dashboards and alert rules. In the case of the metrics used above, you can pin the chart to an enabled dashboard. This can be continued with additional queries as desired until all the required information is compiled in an overview.

The following dashboard shows the metric of the console application. It also contains examples of information regarding server requests, incorrect queries, response times, and performance and availability (see Figure 4).

Figure 4: Information on the dashboard at a glance

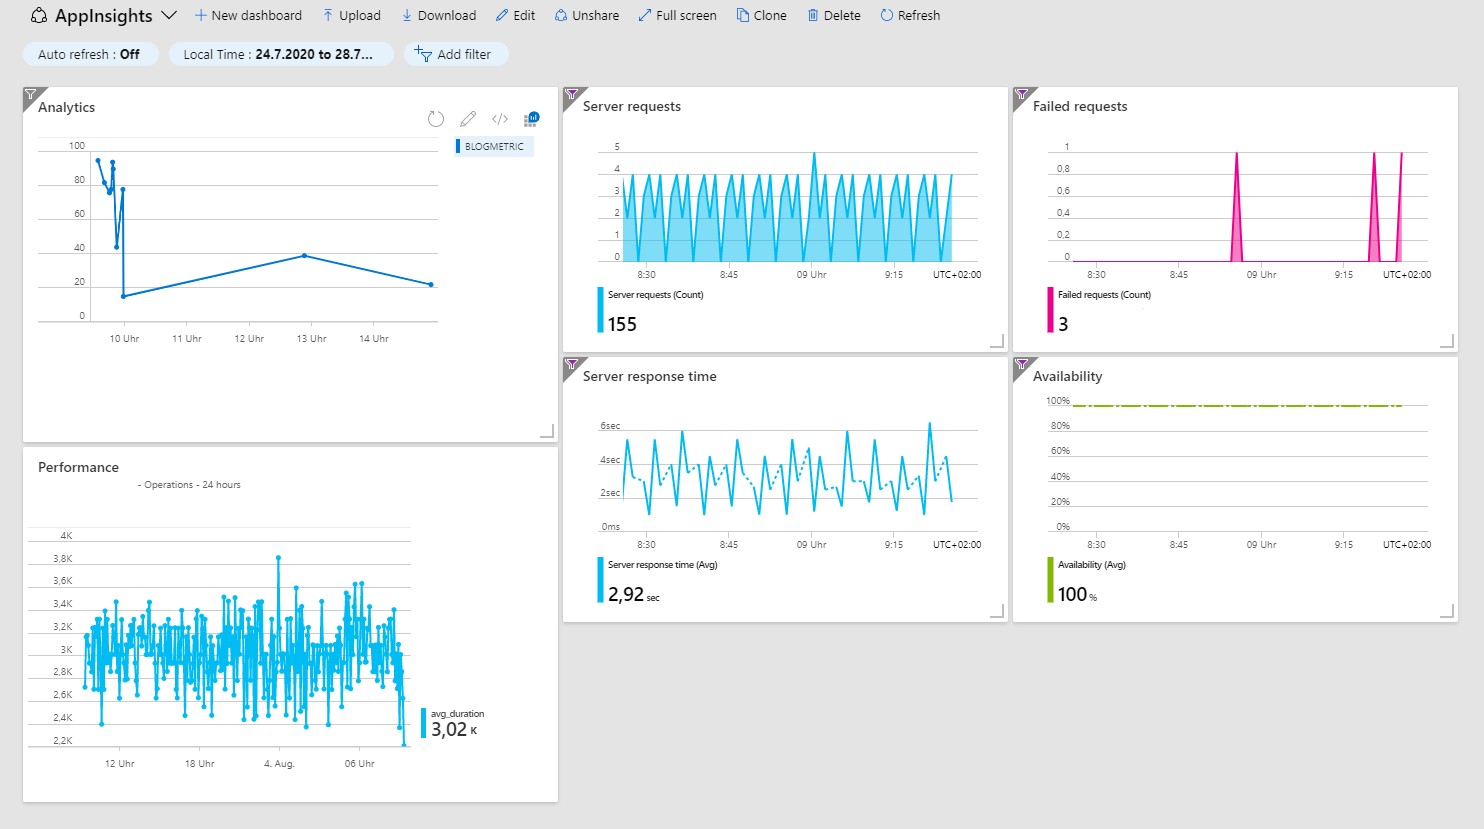
If an anomaly occurs at a time when you do not have an eye on the dashboard, it is also possible to be alerted immediately by email or text message by means of alert rules.

Individual alert rules can be created and managed in the Warnings menu in the Application Insights portal. An alert rule consists of a signal logic (condition) and an action group.

For the condition, you select a signal, e.g. a metric, and define a threshold: “traces greater than 80”. If you get more than 80 trace entries during a defined period of time, the alert is triggered.

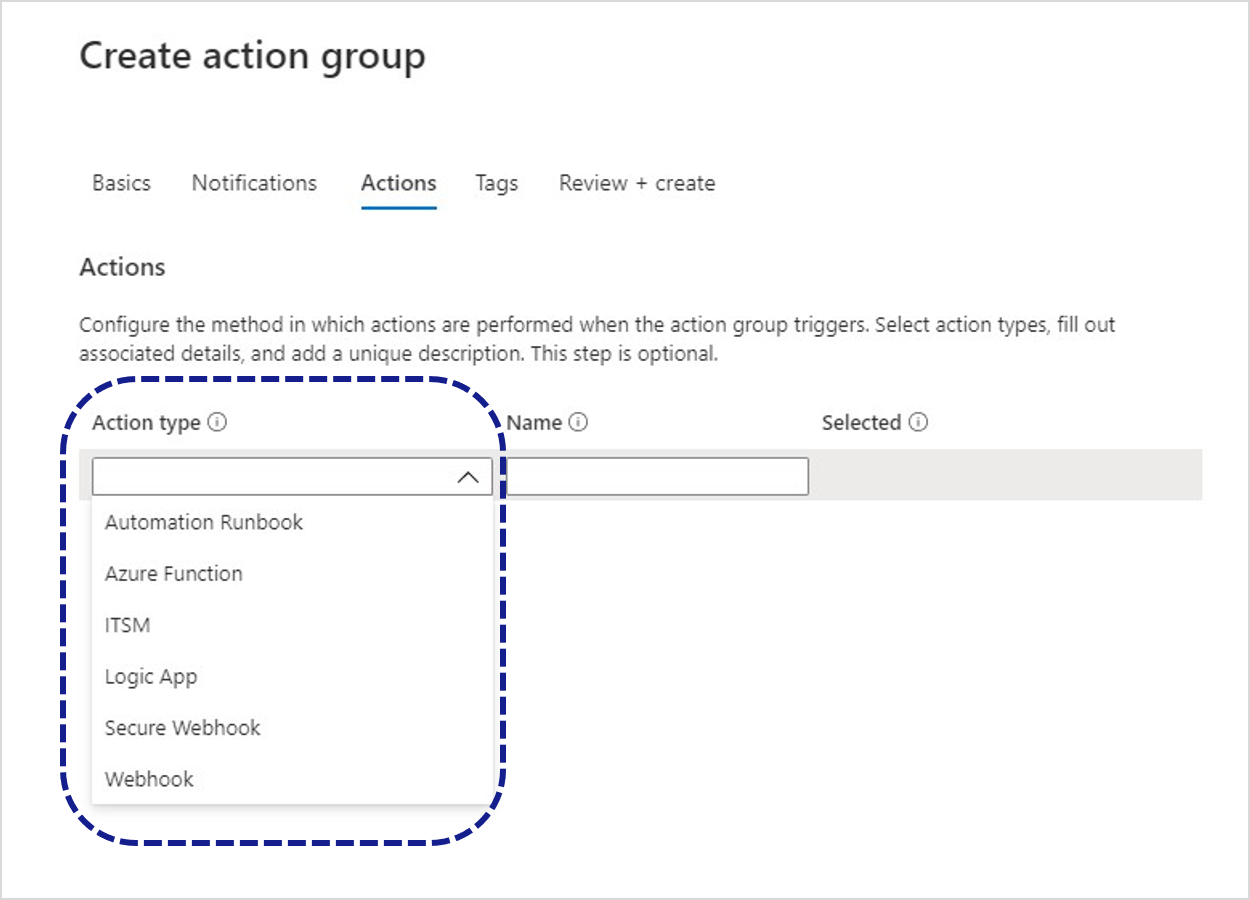
The action group defines precisely what is to be done in the case of an alert. Here, you can have simple notices sent to specified persons by email or text message, or program more complex actions by means of runbooks, Azure Functions, logic apps or webhooks (see Figure 5).

Figure 5: Various types of action in an action group

REST API

If it is necessary for the data to be processed outside of Application Insights as well, they can be requested by means of a REST API.

The URL for API requests consists of a basic part and the required operation. Operations are metrics, events or query. In addition, an API key has to be submitted as “X-API-Key” HTTP header:

https://api.applicationinsights.io/v1/apps/{app-id}/{operation}/[path]?[parameters]

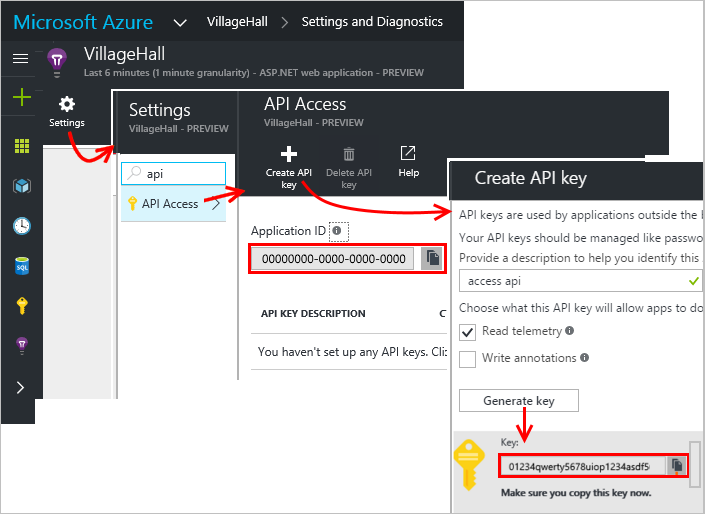
The app ID can be found in the settings under API Access.

Abbildung 6: URL der API-Aufrufe
Figure 6: URL for API requests (Source: https://dev.applicationinsights.io/quickstart)

Continuing with the metrics described above, this is the API request with a query operation for the total number of entries during the last 24 hours:

https://api.applicationinsights.io/v1/apps/{}app-id}/query?query=customMetrics | where timestamp >= ago(24h) | where name contains “Blog” | summarize count()

ago(24h) | where name contains “Blog” | summarize count()

The result is returned in JSON format:

{
    "tables": [
        {
            "name": "PrimaryResult",
            "columns": [
                {
                    "name": "count_",
                    "type": "long"
                }
            ],
            "rows": [
                [
                    13
                ]
            ]
        }
    ]
}

Conclusion

As this example shows, centralized logging can easily be set up and managed by means of Application Insights. In addition to the quick and simple integration, the automated infrastructure is an advantage. No need to deal with the hosting, and if the load increases, Application Insights scales automatically.

Recent trends and challenges in software development

… what participants said about iJS and W-JAX

That there is something going on not only in Saxony, but especially around our headquarter in Munich was shown at the end of last year by the “International JavaScript Conference“ and the “W-JAX“. Both conferences took place shortly after each other and attracted numerous visitors to the Bavarian capital.

Just like the S&S Media Group as event organizer of the iJS (international JavaScript Conference) noticed, JavaScript is everywhere by this time: hardly any digital business can do without JavaScript and high level frameworks like Angular, React or NodeJS these days. It is hardly surprising that there was a whole conference with numerous keynotes, sessions and power workshops dedicated to this topic on iJS during 23. – 27.10.2017 in the Holiday Inn Munich City Centre. The W-JAX, too, partly deals with these topics but offers many additional impulses in the areas of enterprise technology, software architecture, agility and Java.

signs with mit names of iJS and W-JAX conferences
Figure 1: iJS and W-JAX conferences

We took the opportunity on both of the conferences to exchange intensively with the community. That is why we brought some questions to put them to the participants of the conferences. We were able to conduct close to 100 surveys total, that split to share equally among the two events. We would like to take this opportunity to once again thank all those who took the time to participate in our survey. Only through an intensive exchange with partners, customers and community can we succeed in constantly improving. This approach of continuous improvement, which is also anchored in the agile manifesto, is not only taken within our projects, but is also lived across the company.

While our experts Manuel Mauky and Alexander Casall spoke about topics like “Angular applications with Redux“ and “Offline-capable desktop application with Angular and Electron“, we first of all wanted to know the frameworks and languages that were used by our interview partners in their main projects at that time. Angular and JQuery were used most often, followed closely by JavaEE and Spring. React for example was still used quite rarely. Additionally, 72 of 88 interviewees used JavaScript, 69 HTML and 51 used Java as programming language. Ruby, Groovy and CoffeeScript on the other hand were used quite little and got a maximum of 5 votes each.

Survey: Which frameworks do you use in your main project?
Figure 2: Which frameworks do you use in your main project?

Of course, we were not only interested in the technologies currently used, but even more important is the direction in which the trends of software development are moving. More and more users of business computer programmes expect modern web applications instead of existing desktop software. The usability of those often does not meet the expectations of the users in times of modern B2C-applications and so more and more web-based solutions, that are actively supporting the user with their work, are established. It is therefore not surprising that 70% of the respondents were planning to work with Angular, React or another interactive technology (e.g. ReactiveX, RxJS). Vue.JS (14 votes) and JavaFX (3 votes) on the other hand only play a tangential role.

Survey: Do you plan to work with one of the following technologies in the nearest future?
Figure 3: Do you plan to work with one of the following technologies in the nearest future?

Half of the polled participants could position themselves quite precisely and settled either for Angular, React, or at least a reactive technology. But about 20% were still indifferent and not able to decide between Angular and a reactive technology. The decision matrix that we evaluated could be of assistance here, which provides a personal technology recommendation with the help of a list of questions. It is based on the experiences of our web experts.

Furthermore, the content of a project is important when choosing a suitable programming language or a framework, of course. This is why we asked the survey participants what they were doing in their main project. The majority was dealing with software evolution projects (61 votes), closely followed by new developments (56 votes). About one fifth was dealing with DevOps in everyday working live. Depending on whether maintaining an existing software or having a green-field project on the table, the tolerances when choosing programming languages and tools can be very different.

Survey: What are you doing in your main project?
Figure 4: What are you doing in your main project?

Now that we had found out a little more about what the respondents were doing, most of whom were software developers of different nationalities and from a wide range of industries and company sizes, we wanted to know what was holding them back most in the current project. At this point, we gave quite open answer possibilities like “bad code” or “bad architecture” on purpose to leave the interviewees some room for interpretation and challenge them to address problems and where possible initiate a first dialogue to solve the problems.

The most frequently mentioned problems are shown in the following graphic. Additional to the answers shown here, where “unclear requirements” is still one of the major problems, there were a few free answers. “Legacy code”, “waiting for the client / customer” or “rapidly growing and confusing software architecture” were mentioned quite often.

Survey: What frustrates you most in your main project?
Figure 5: What frustrates you most in your main project?

Finally we turned to some questions of the area of “modern web development” to verify, which trends are actually confirmed by the community and which ones are “hyped” in the web but are not yet arrived in everyday developer life. One of these trends in information technology is for example GraphQL. We first asked the basic question on how the conference visitor’s position on this technology is. Only one forth of the respondents were planning to use this REST alternative for the future or were already using GraphQL, while almost half of them have never heard of this technology before.

Survey: What do you think about "GraphQL"?
Figure 6: What do you think about “GraphQL”?

Additionally we wanted to know, whether the interviewees were utilising cloud technologies in their projects. Here, the ratio of the responses was nearly balanced. 45% affirmed the statement, while the other 55% are not, or at least not in their main project, working with cloud technology. The second question of this thematic block was about the technology currently used by the surveyed for state management. The options were React/Angular (without extra framework for the state management), Redux or MobX. While the latter only got one vote, the majority (around 50%) did not use an extra framework and approximately 25% work with Redux, while about again 20% did not give an answer, which unfortunately distorts the survey results somewhat.

Couples Therapy – Successfully Integrating Service Providers

In a survey carried out by Capgemini (Capgemini Consulting, 2016), the respondents stated that the biggest obstacle for digitalization in their company was “Too few employees with relevant know-how”. It is not uncommon to try and overcome this problem by integrating one or several external service providers. The same survey furthermore shows that these service providers are increasingly used in areas or projects where innovative solutions are to be developed. It is likely in this context that an average 23.3% of the respondents already use agile frameworks, methods or philosophies such as scrum, Kanban, DevOps, or the Scaled Agile Framework in their projects.

As a service provider, we have already been relying on agile methods for a long time. Since 2013, we have formed mixed teams involving the client and the service provider according to our concept of distributed agile development, ETEO (German for “One Team, One Office”), and we provide tools and good practices to assist these teams during the initial unfamiliar work situation. The concept uses the results of a survey of our teams that had already been working according to this model, and it was subsequently further developed on a scientifically sound basis by a cross-functional team, with new findings from our teams continuously being integrated.

In our case, the team is assembled in a project room. The physical rooms (typically 2-3) at the distributed locations are connected via permanent video conferences. Each location preferably has an 80 inch screen, creating the impression that you see the other part of the team through a window.

A tool that we work with both in our teams and in external coaching sessions is the ETEO Value Compass, which combines the five scrum values of openness, commitment, focus, respect and courage, along with additional values that appear to be essential, particularly, but not only in distributed teams: identity, trust, empathy, collaboration and simplicity.

During the coaching, we usually ask the teams which of the values is most important to them. Not surprisingly, many of them say that the value of trust is most important. In his book “Five Dysfunctions of a Team” (Lencioni, 2002), Patrick Lencioni stated that trust is the basis for any kind of collaboration in a team. And ultimately, the individual values also appear to affect each other. Openness in the team, for example, creates trust. And with scrum, where it is not the individual contribution, but the team performance that counts, committing to a common sprint goal is possible only if everybody trusts everybody else.

But how do you build trust in a distributed team that rarely meets in person, where a little misunderstanding cannot easily be resolved over lunch or a cup of something hot in the communal kitchen? Unspoken issues can quickly spark conflicts, disturbing or completely destroying the trust within the team.

Couples therapy

This is why it is particularly important to get to know each other during an extensive, 6- to 8-week attendance phase, during which you learn to assess each other. Written, asynchronous communication, e.g. by email, can easily cause misunderstandings. The permanent video conference has proven to be highly useful in this context because it allows everyone to see who is present and how they apparently feel. Still, even with a video conferencing system, you should be careful not to use it exclusively for the professional exchange. Once trust has been damaged, it is surprising to see how even a small verbal or non-verbal signal can cause what is left of the trust to be completely shattered. In one of our project teams, for example, the team members in one of the locations used to lean back against the table behind them during the video conference for the daily scrum meeting because it was more comfortable for them. The colleagues at the other location, however, stated that this appeared as a threatening front to them. Such misunderstandings happen in particular if you fail to invest in strengthening trust, and the team does not meet in person at regular intervals (every 6-8 weeks).

Doing each transition from one sprint to the next at the same location is even better. This also offers an opportunity to do the sprint retrospective in one room together—a serious advantage in a meeting where the trust within the team generates a significant added value. Trust is the foundation for mutual respect and for the courage to realize the potential for improvement within the team with creative, innovative solutions.

Working with a common value system is just one of the challenges you face when you want to integrate an external service provider. We will address this issue in more detail in our presentation “Darling, I’ve met someone new – Successfully integrating service providers” at the solutions.hamburg conference. The track „Couples Therapy 2.0“ provides additional exciting insights and therapeutic approaches from the intriguing field “IT meets business”.


References

  • Capgemini Consulting. (2016). IT Trends 2016. Retrieved at capgemini: https://www.de.capgemini.com/resource-file-access/resource/pdf/capgemini-it-trends-studie-2016_0.pdf
  • Lencioni, P. (2002). 5 Dysfunctions of a Team. Jossey-Bass.